Dynamic Forecasting
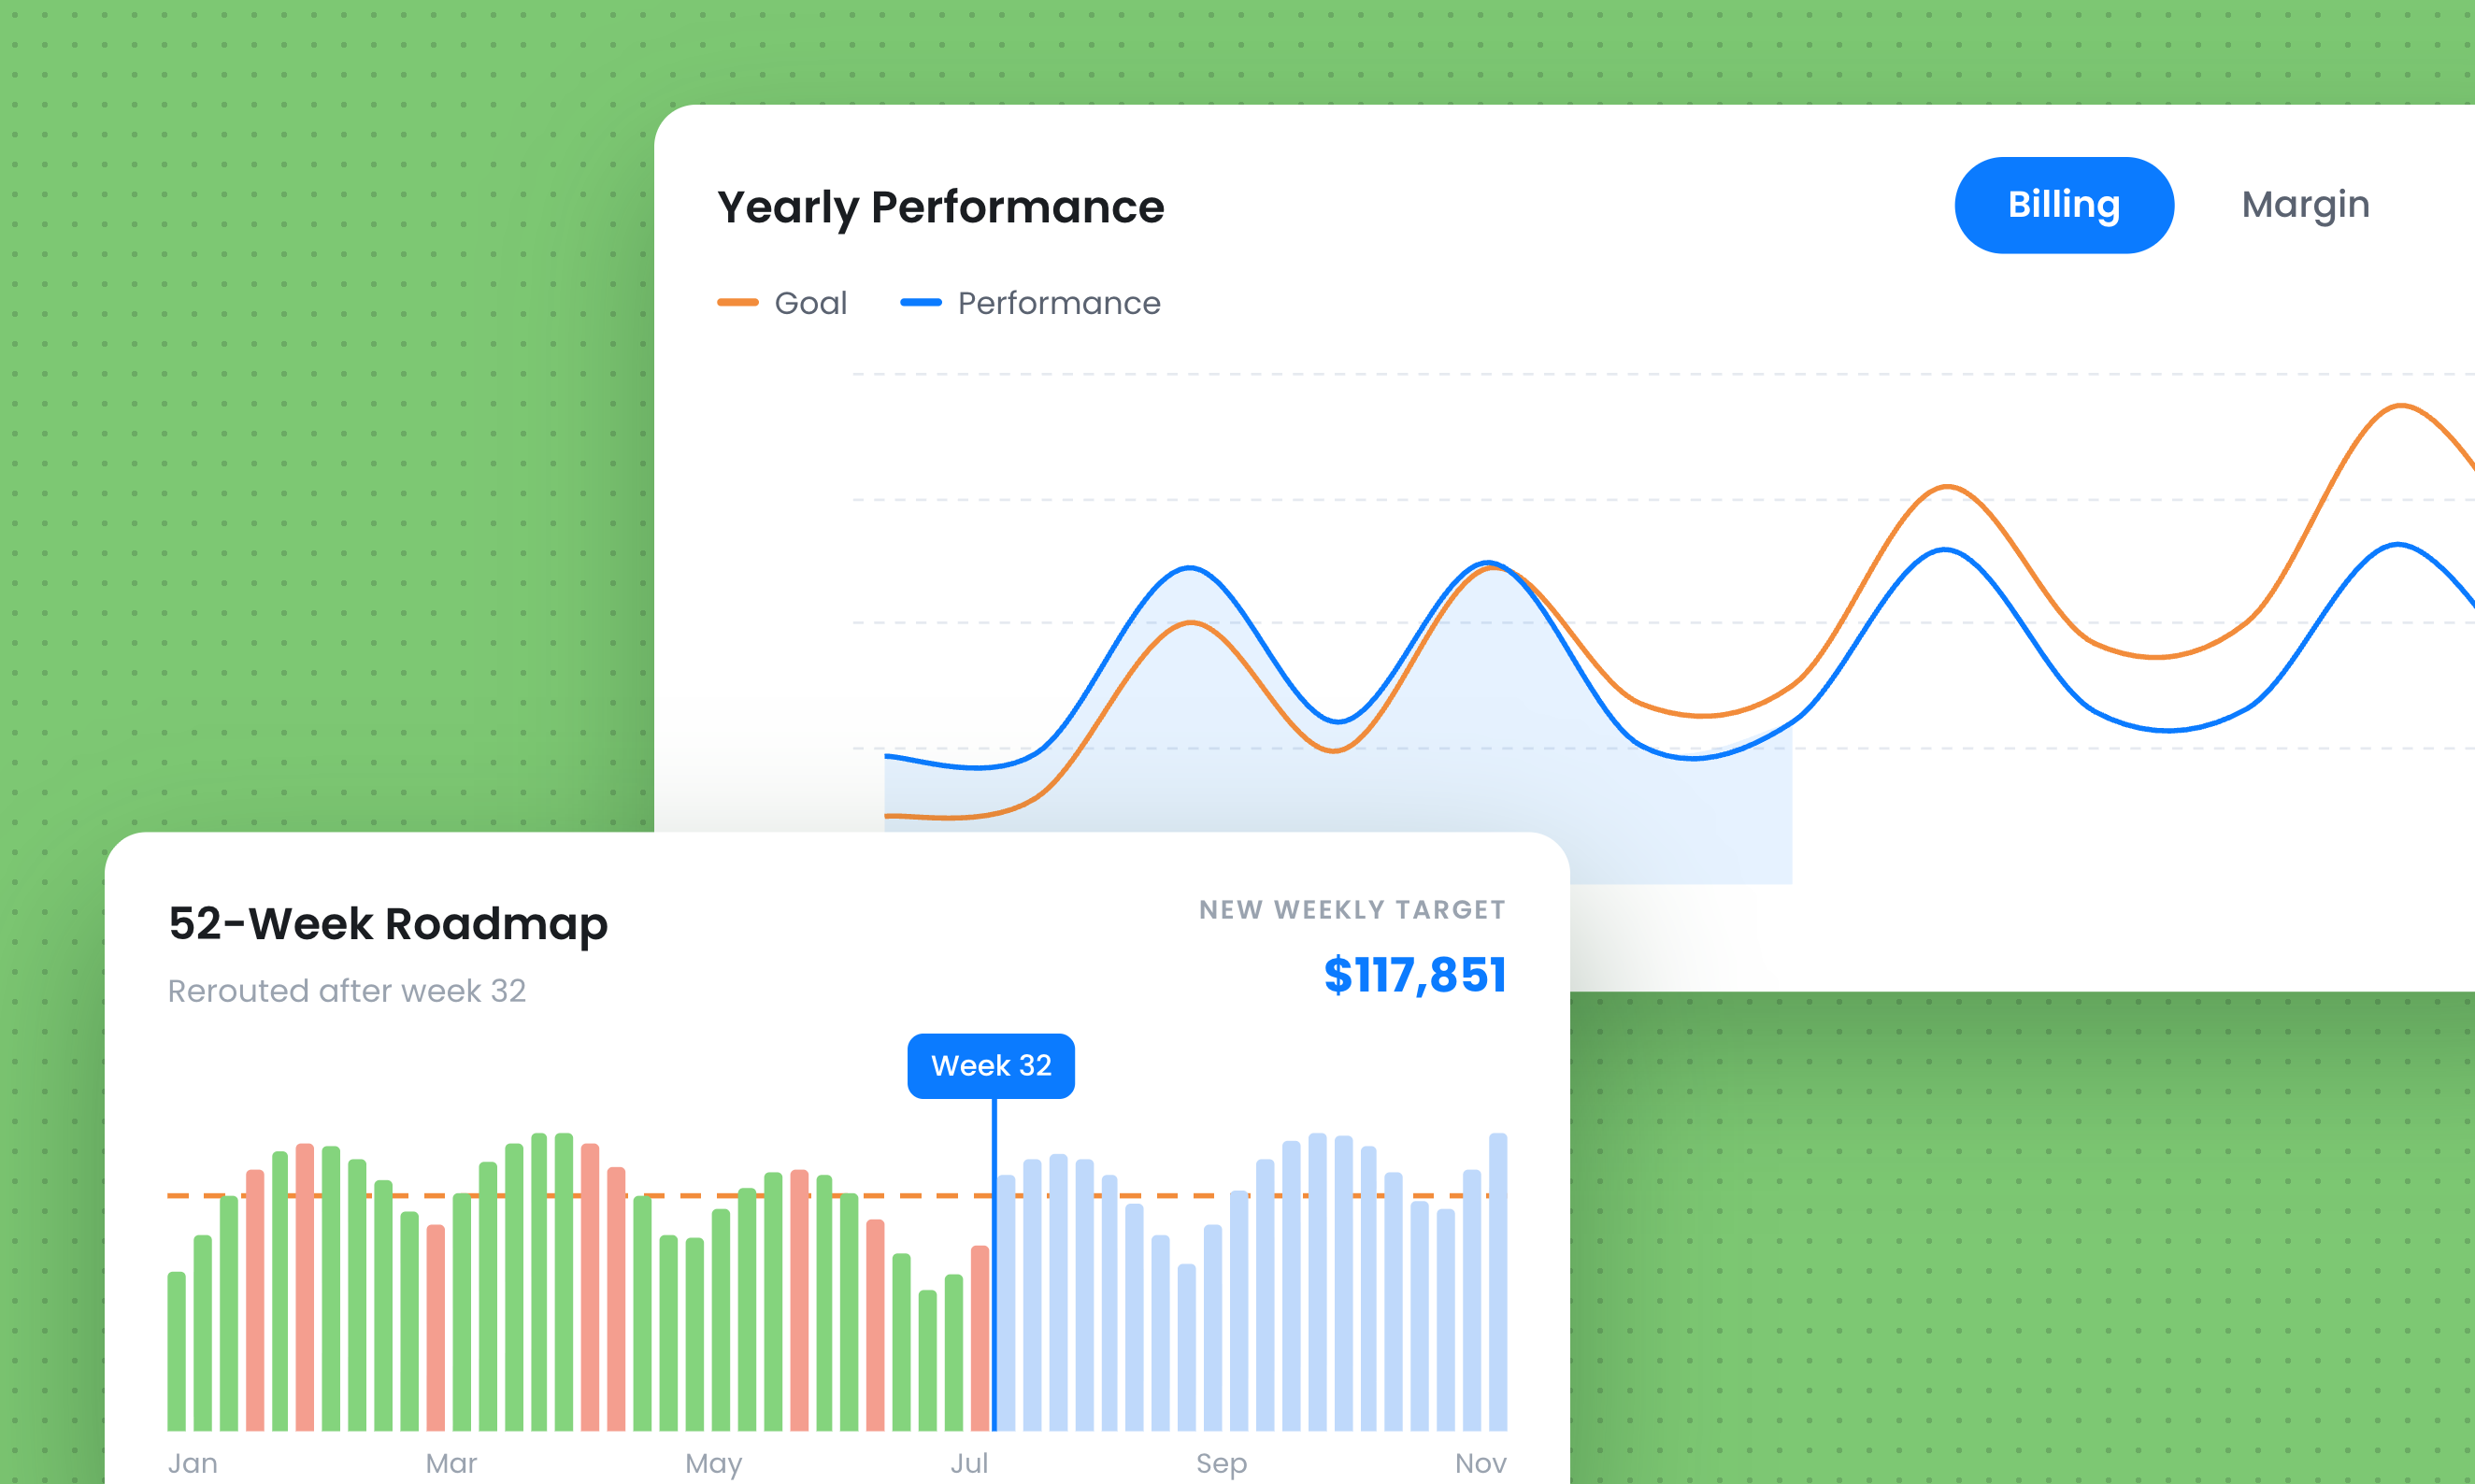
Your 52-week roadmap updates every week, not once a quarter. If you underperform, we redistribute what's needed across the weeks ahead, so you always know the real number required to hit your goal, not the one you set in January.

Built by a staffing agency owner. Trained on staffing decisions.
Staffing Dashboard turns the numbers you already have into a weekly roadmap to your goals. When you drift off pace, it shows you why, and what to change this week. Most leaders get from a red flag to a root cause in under five clicks.

The Problem
You've got a P&L. Maybe a dashboard from your ATS. Maybe a spreadsheet someone built three years ago that only one person knows how to update. None of it tells you why you're off pace, or what has to change this week to fix it. So you guess. Or you wait for the monthly report. Or you find out your numbers were wrong for a quarter, after it's too late to do anything about it.
What It Is
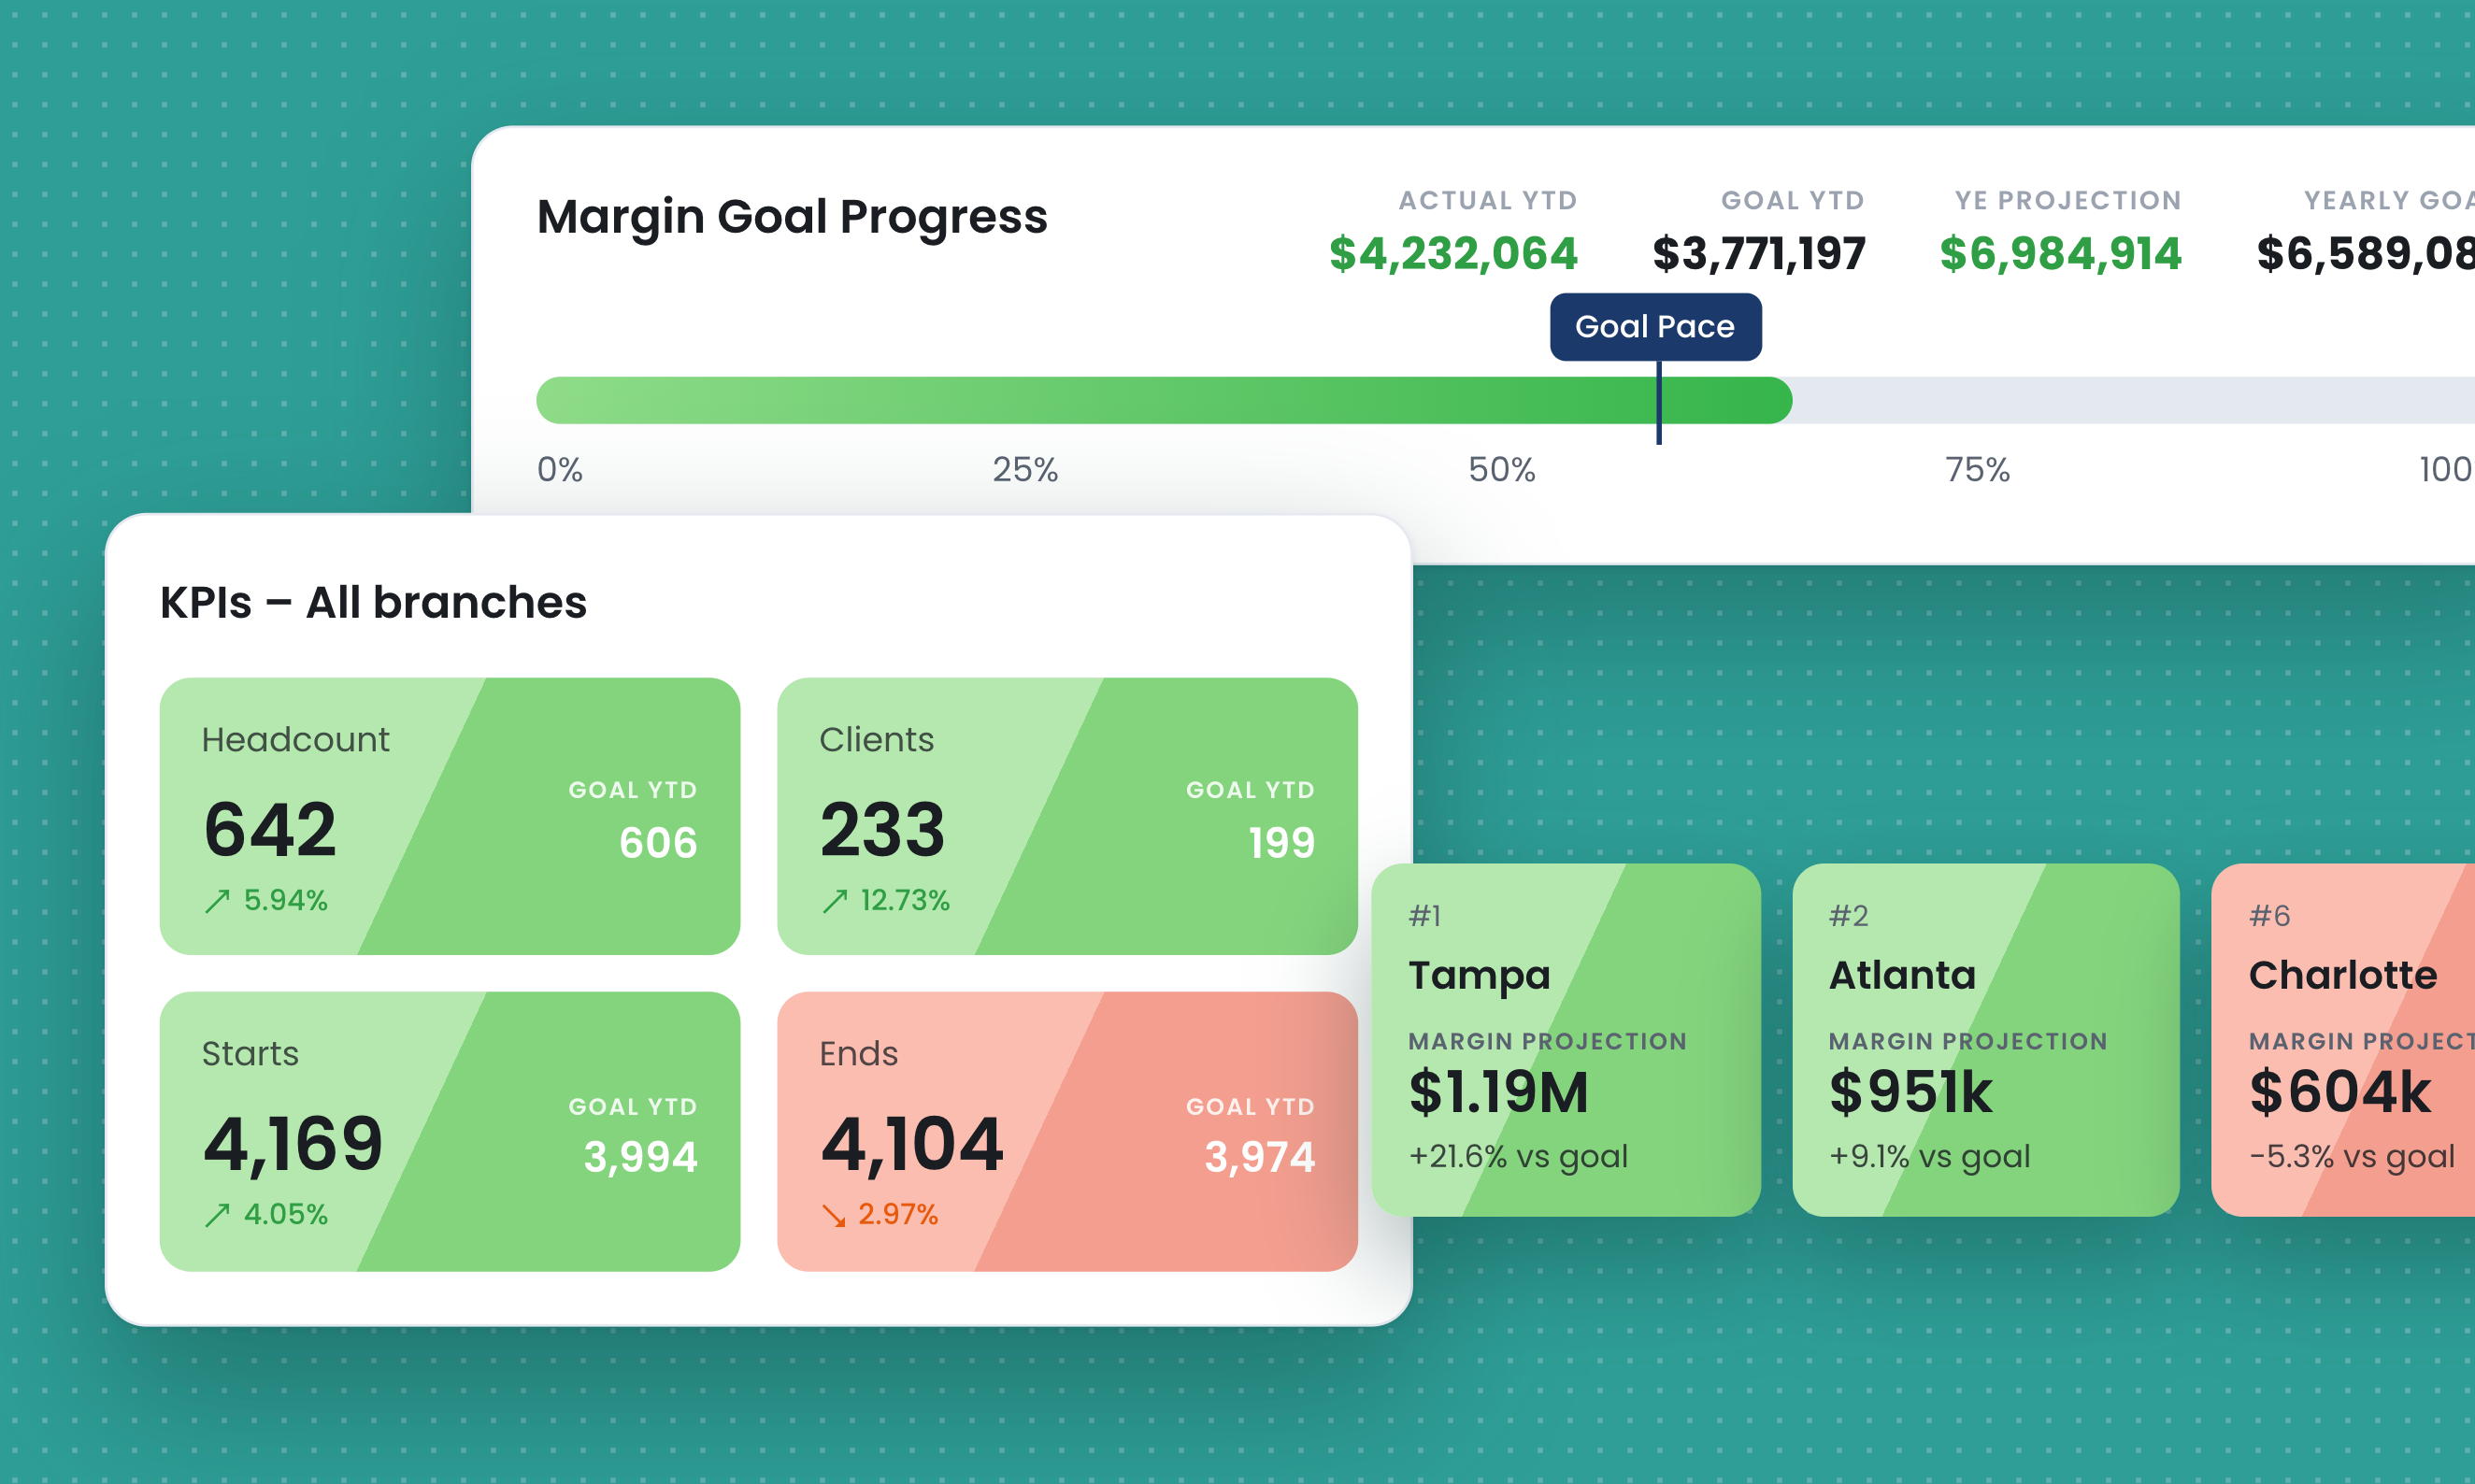
Most reporting tools show you where you've been. Staffing Dashboard shows you where you're going, and reroutes you the moment you drift off course. Set your goal. We plot the most efficient path to hit it, based on your actual performance data: turnover, fill rates, markup trends, sales activity, all of it. Every week, as new data comes in, the route recalculates. Fall behind on Tuesday, and by Wednesday we've already told you what it'll take to catch back up. No more finding out in Q4 that the pace you set in Q1 quietly stopped working.
Three Pillars
Your 52-week roadmap updates every week, not once a quarter. If you underperform, we redistribute what's needed across the weeks ahead, so you always know the real number required to hit your goal, not the one you set in January.
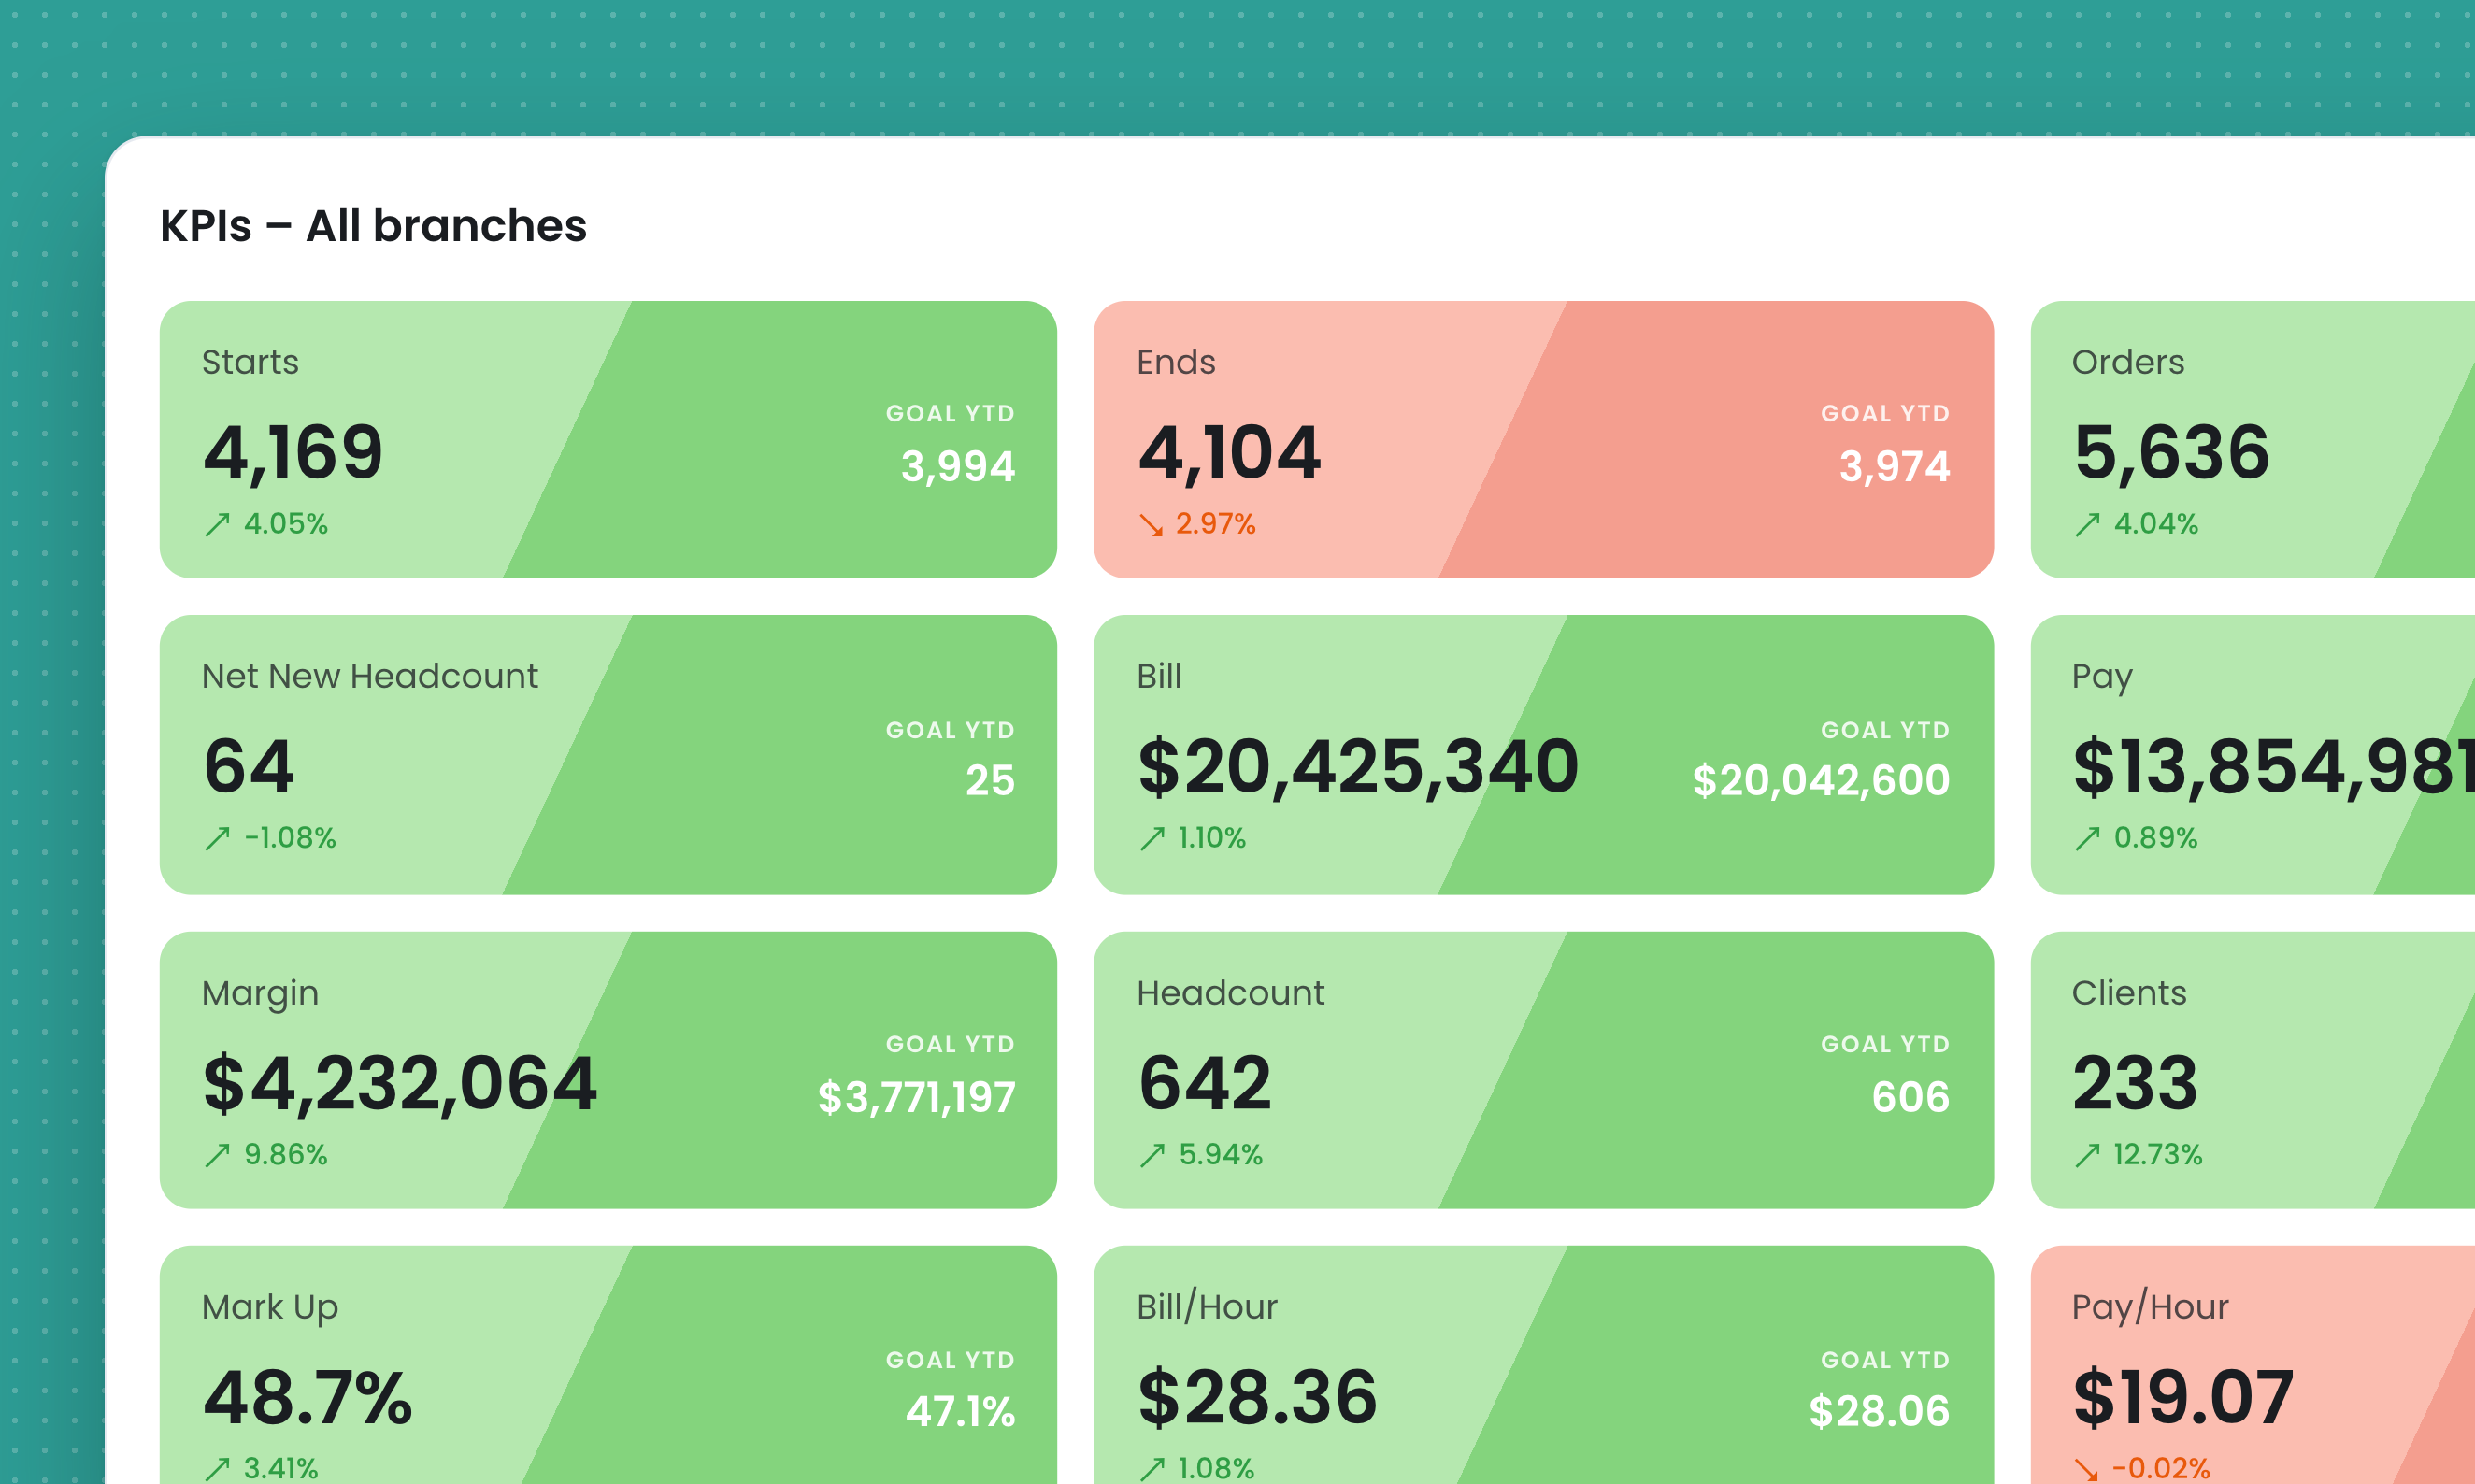
When a KPI flashes red, click it. Our insights engine, trained exclusively on staffing executive decision-making, not generic business advice, runs a root-cause analysis in under 5 clicks and tells you exactly what's driving the miss.
Talk to your data like you'd talk to your best analyst. Ask who's crushing it, who needs support, and what to do about it. You get a straight answer back, instantly.
“The Dashboard revealed a drop in Hours per Headcount. That helped us uncover an attendance issue before the client even noticed. It made us look like heroes.”
Who It's For
Whether you're running 2 branches or 20, if you're doing $15M to $100M+ in revenue and you're tired of static reports that tell you what happened instead of what to do next, this is for you. Industry doesn't matter. Data is data.