
Assignment Starts
The Product
One Platform. Every Number That Matters. One Reason for All of Them.
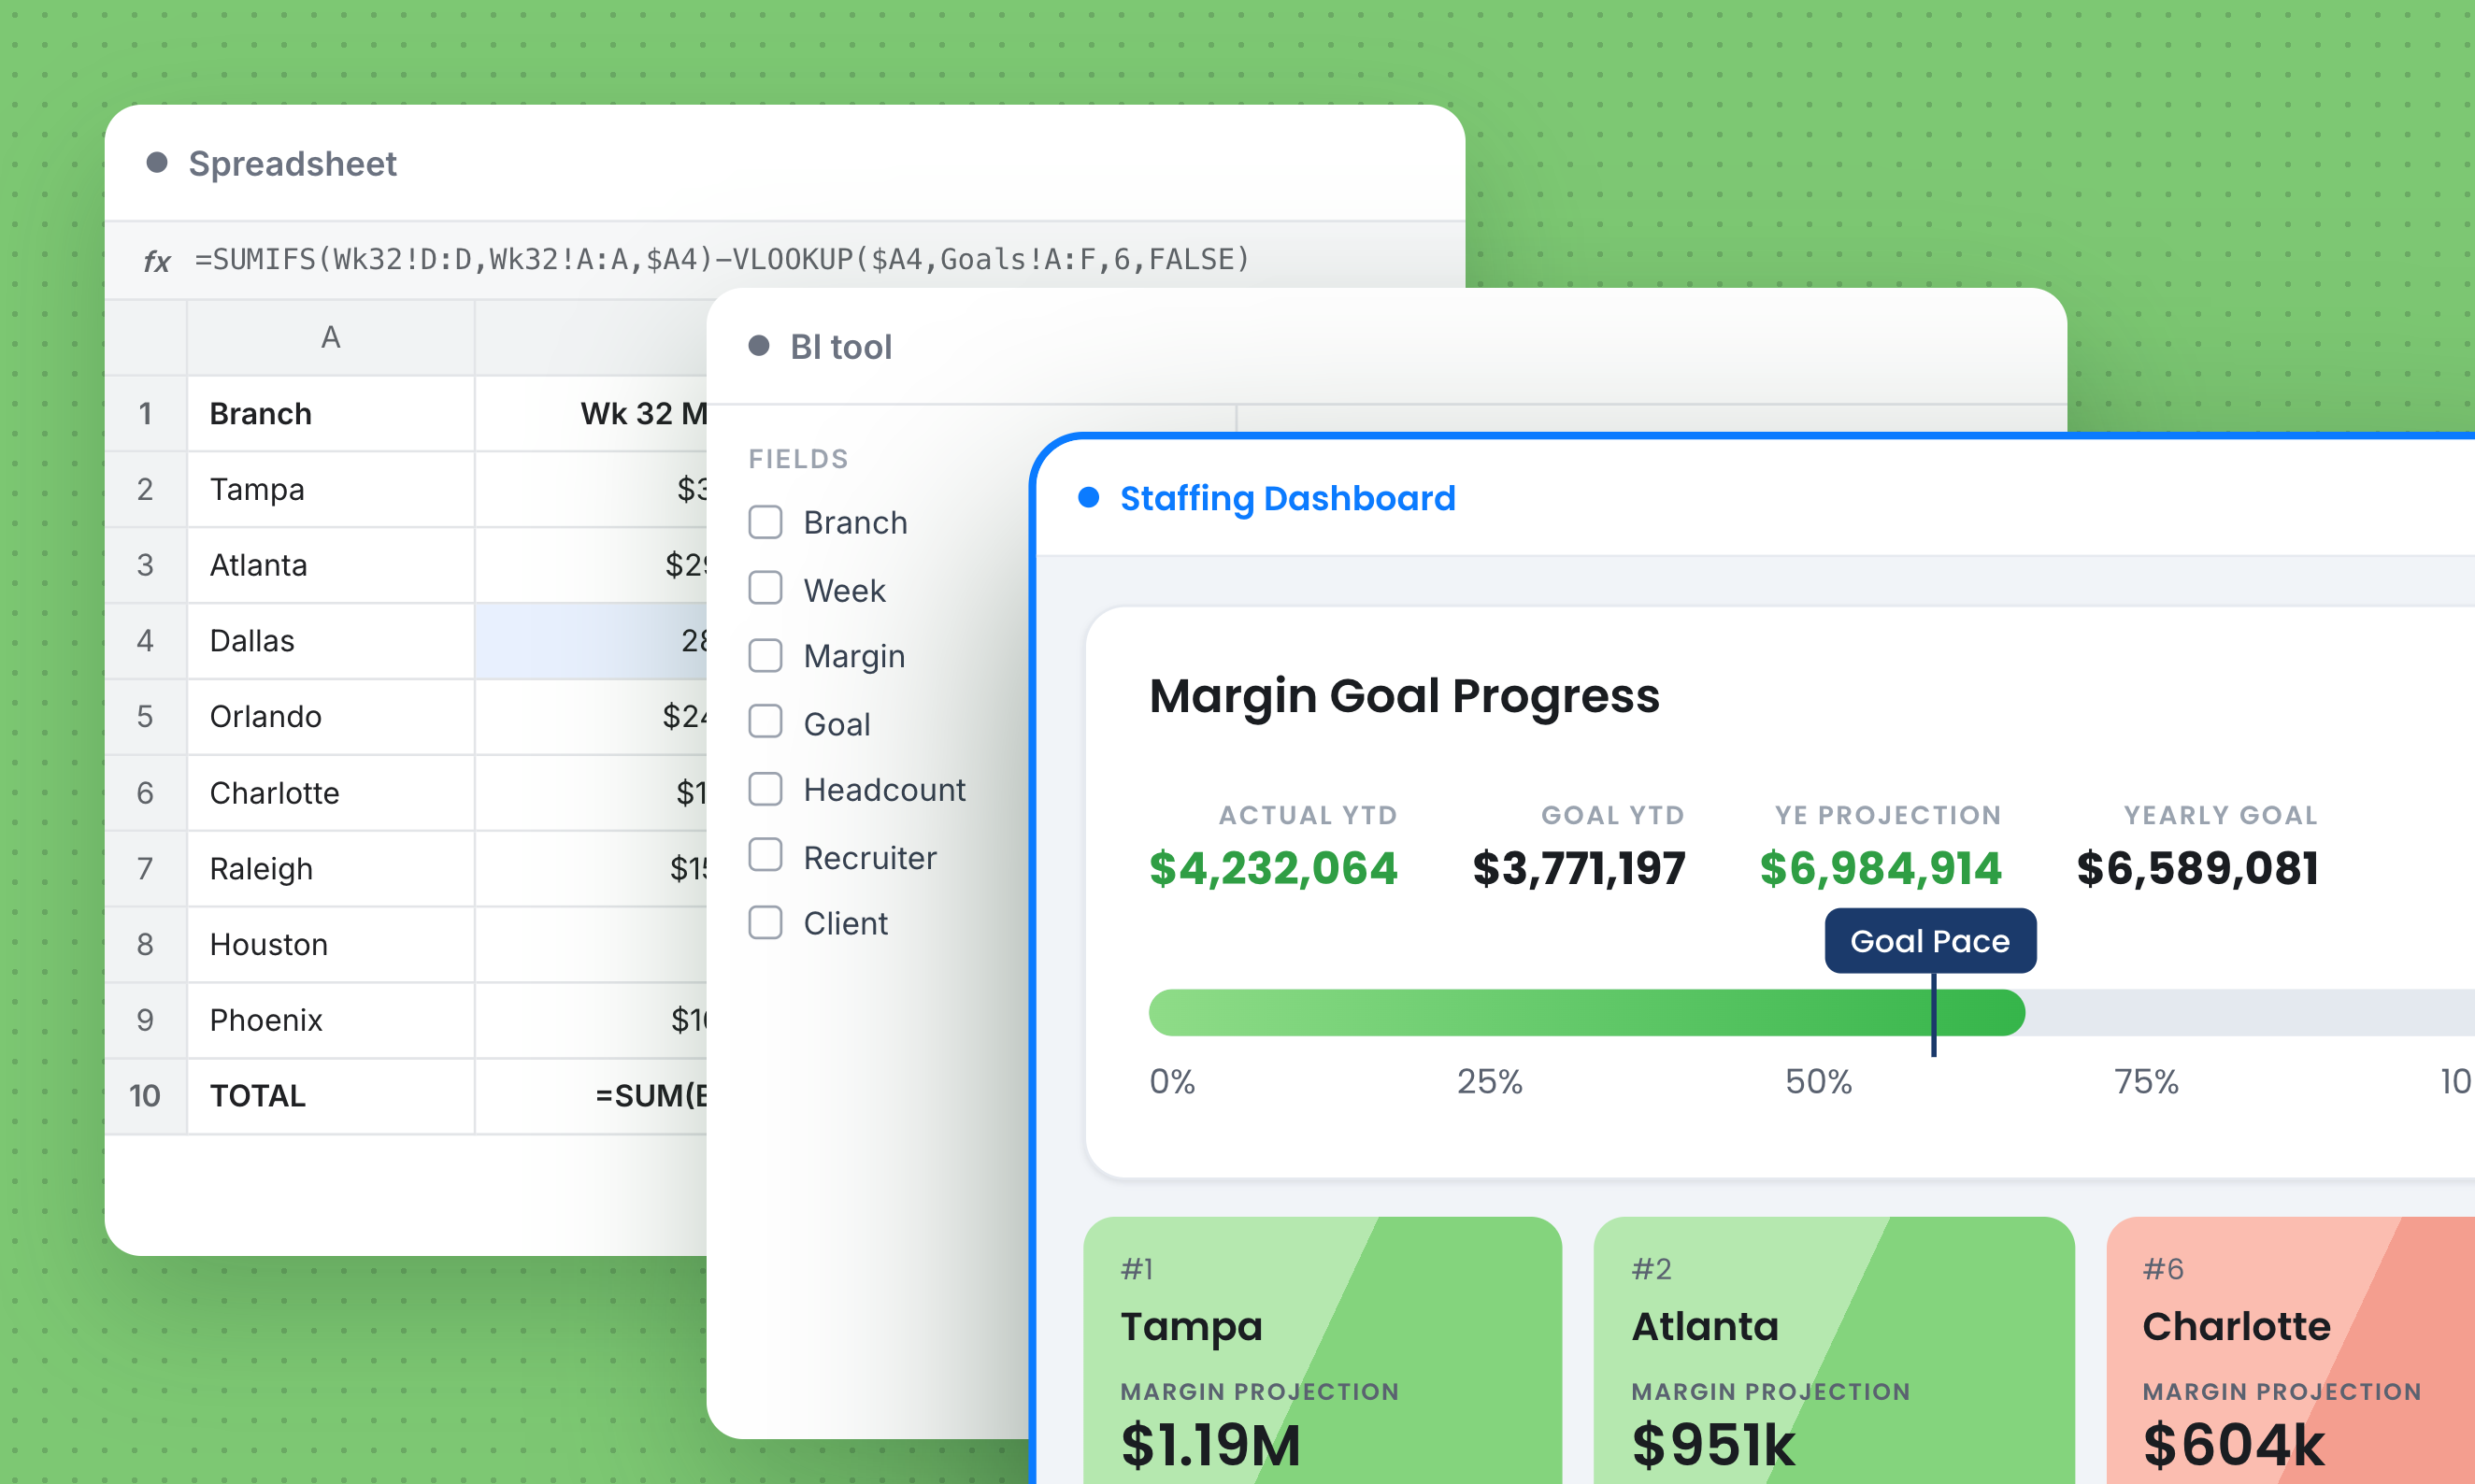
Staffing Dashboard connects your agency's performance data to a forecasting engine and an insights model built for staffing leaders. You always know where you stand, where you're headed, and why.
Clarification
Let's clear something up first.
Staffing Dashboard is not an ATS. It's not a CRM. It's not a place to store candidate records or manage your pipeline. You already have tools for that. It's not "just a dashboard," either. Pretty charts don't grow your agency. Decisions do. Staffing Dashboard exists for one reason: to turn your data into the next right move, fast.
KPIs
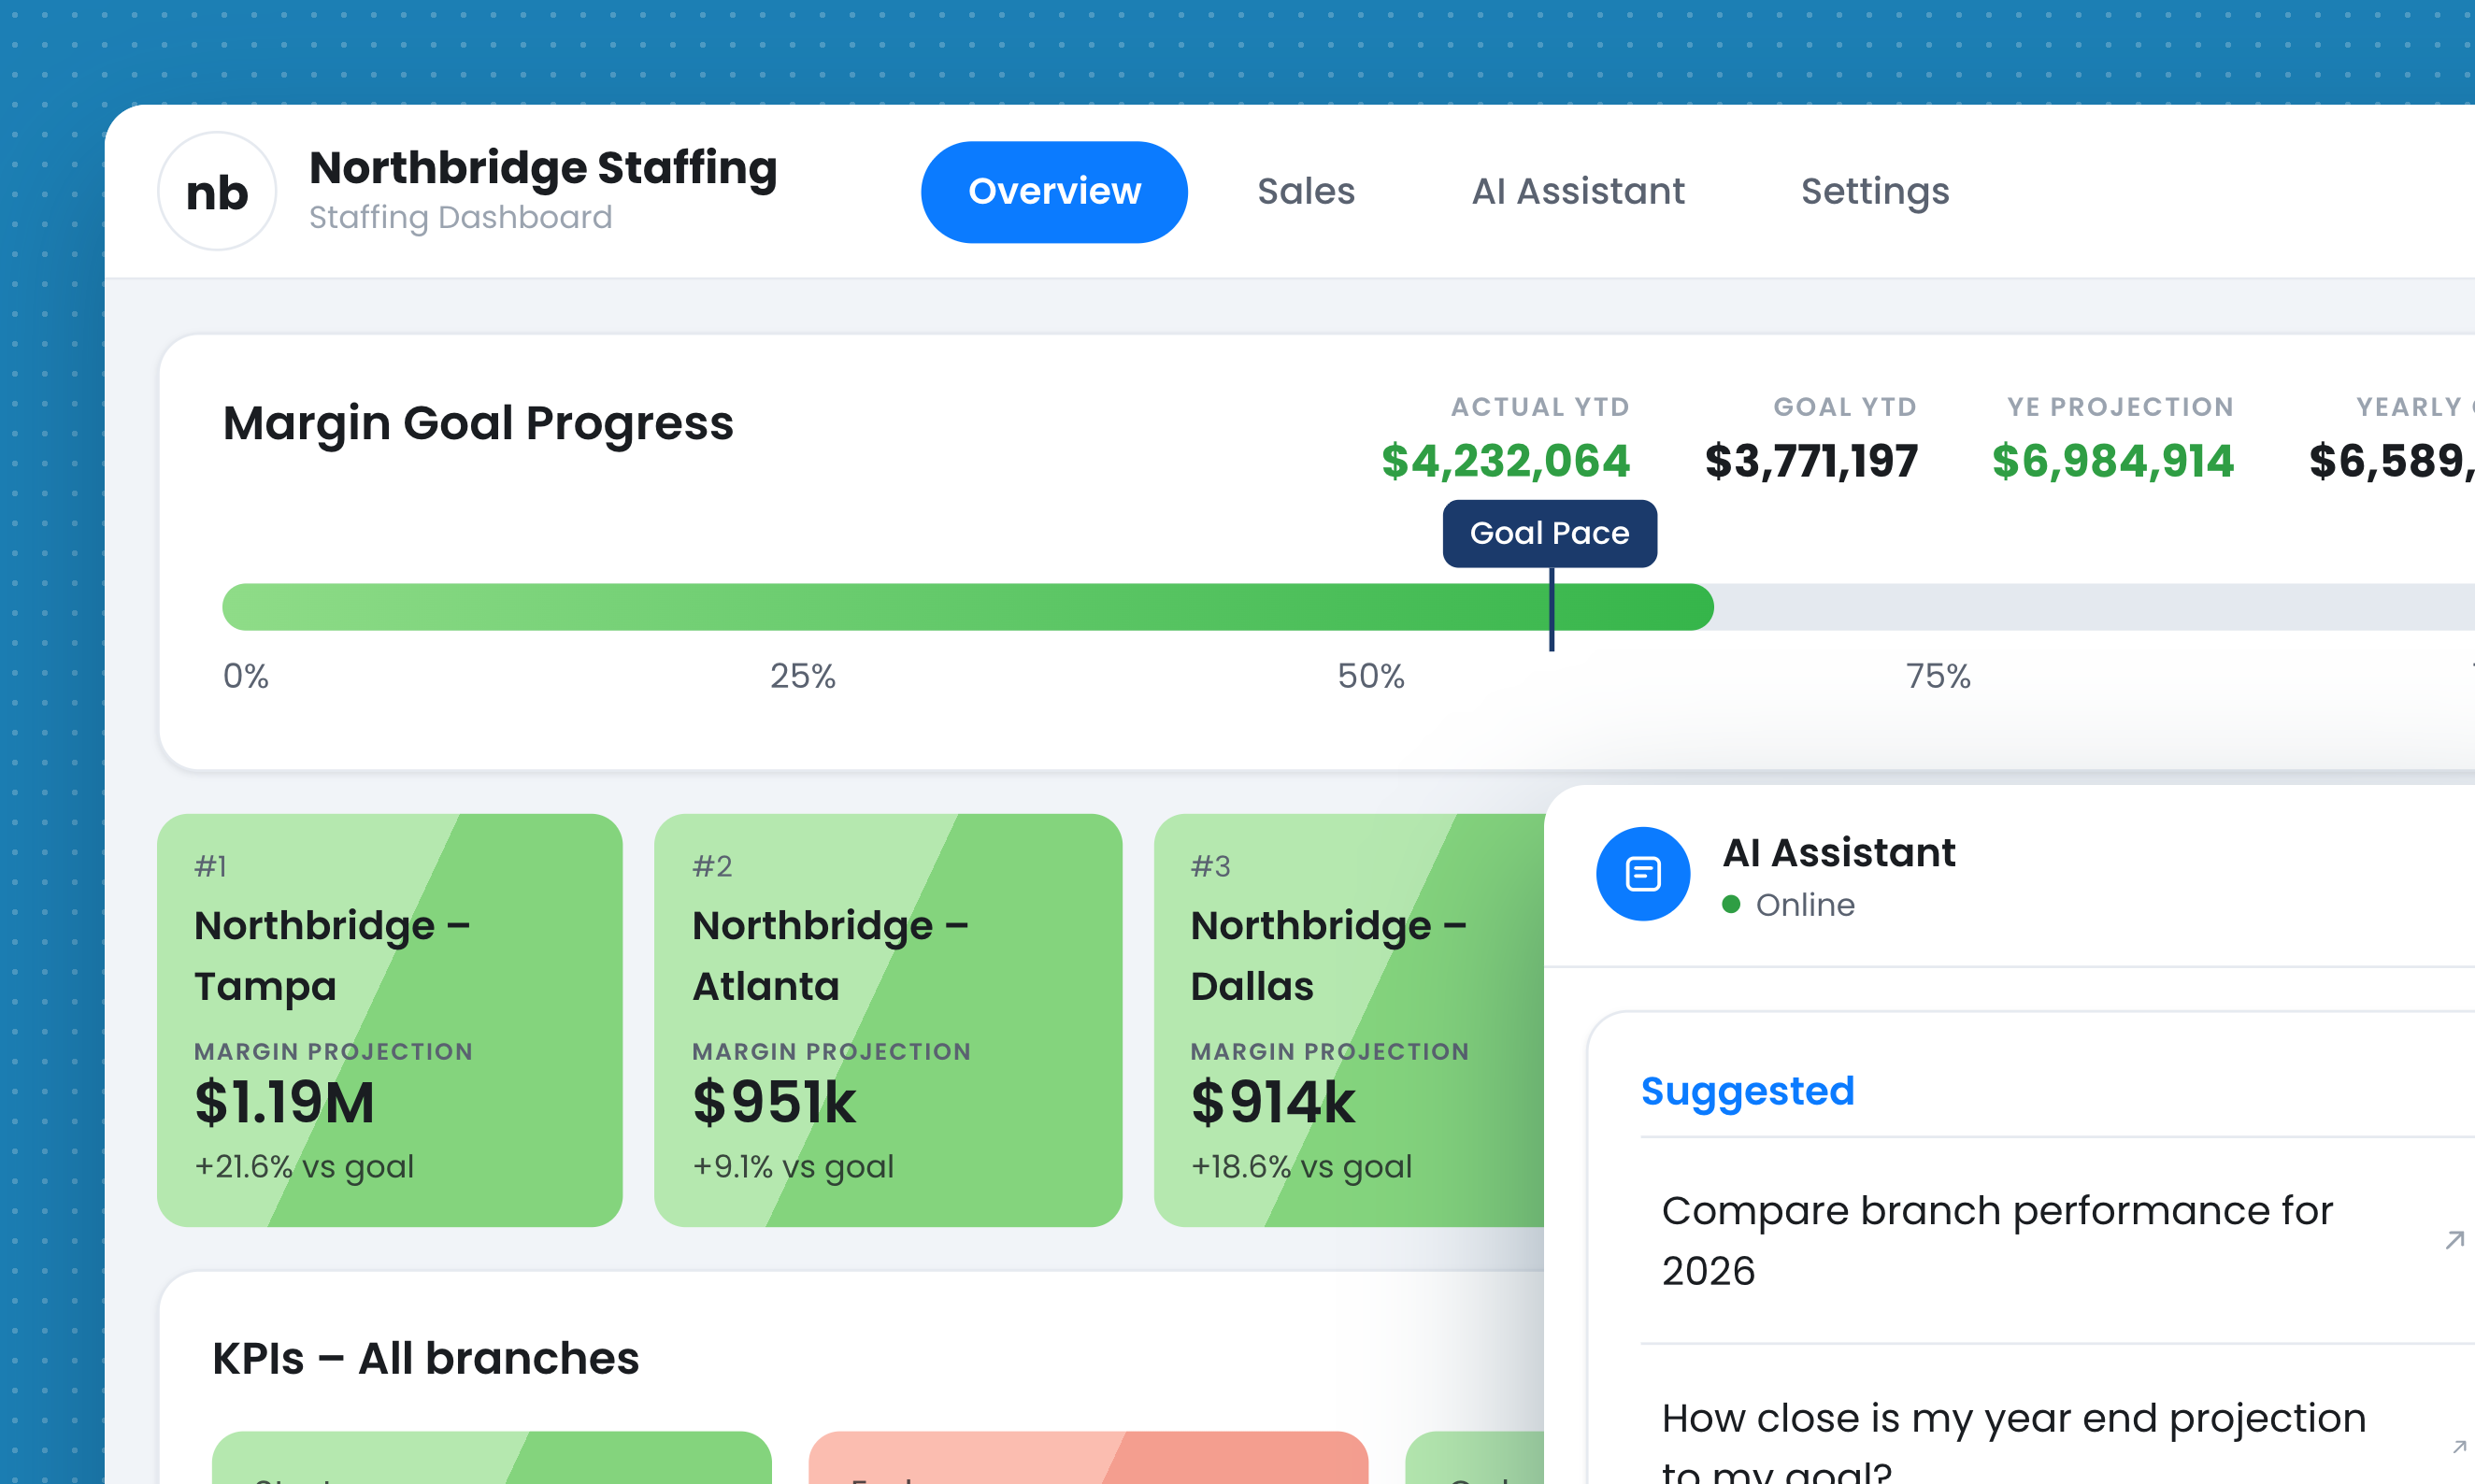
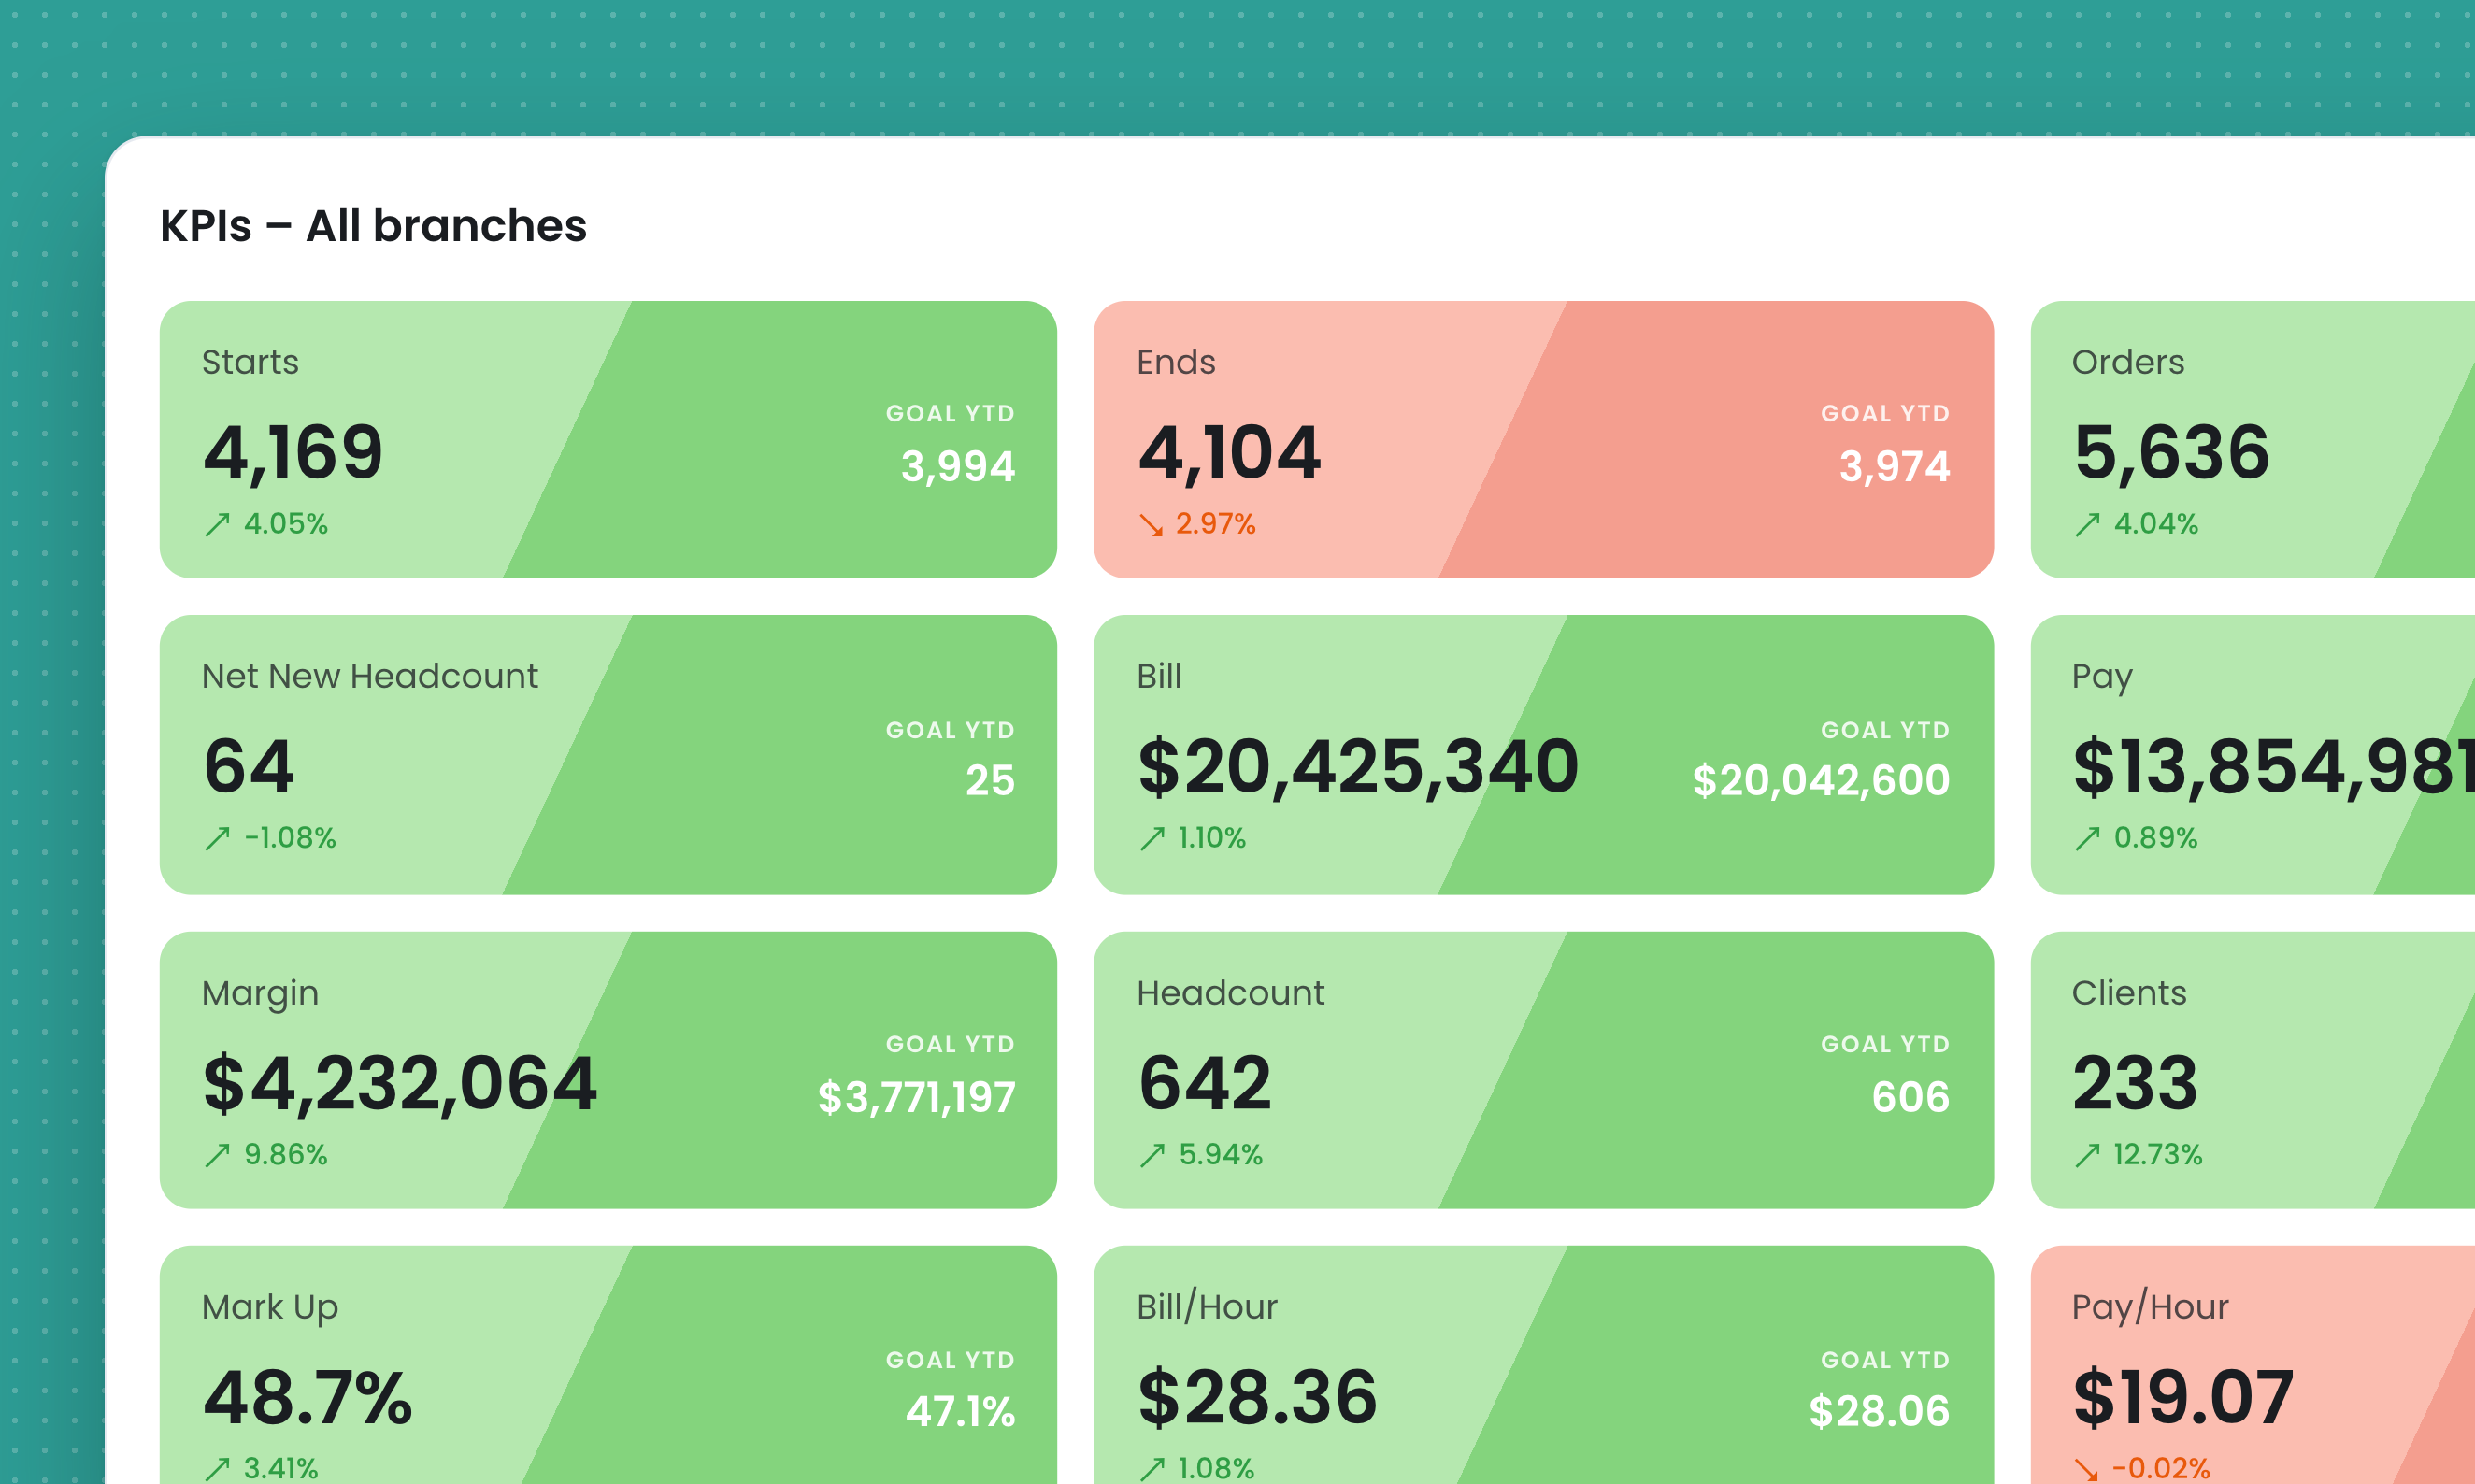
16 KPIs. Zero guesswork.
Every metric that actually drives staffing agency performance. Assignment starts and ends, open job orders, billings, pay, margin, and the rates behind them, tracked in real time at the company and branch level. Each one flags early if you're on pace, and exactly how far off you are if you're not.
- Assignment Ends
- Open Job Orders
- Net Headcount Change
- Client Billings
- Contractor Pay
- Gross Margin
- People on Assignment
- Active Clients
- Markup on Pay
- Bill Rate per Hour
- Pay Rate per Hour
- Margin per Hour
- Hours per Person
- Margin per Person
- People per Client
Dynamic Forecasting
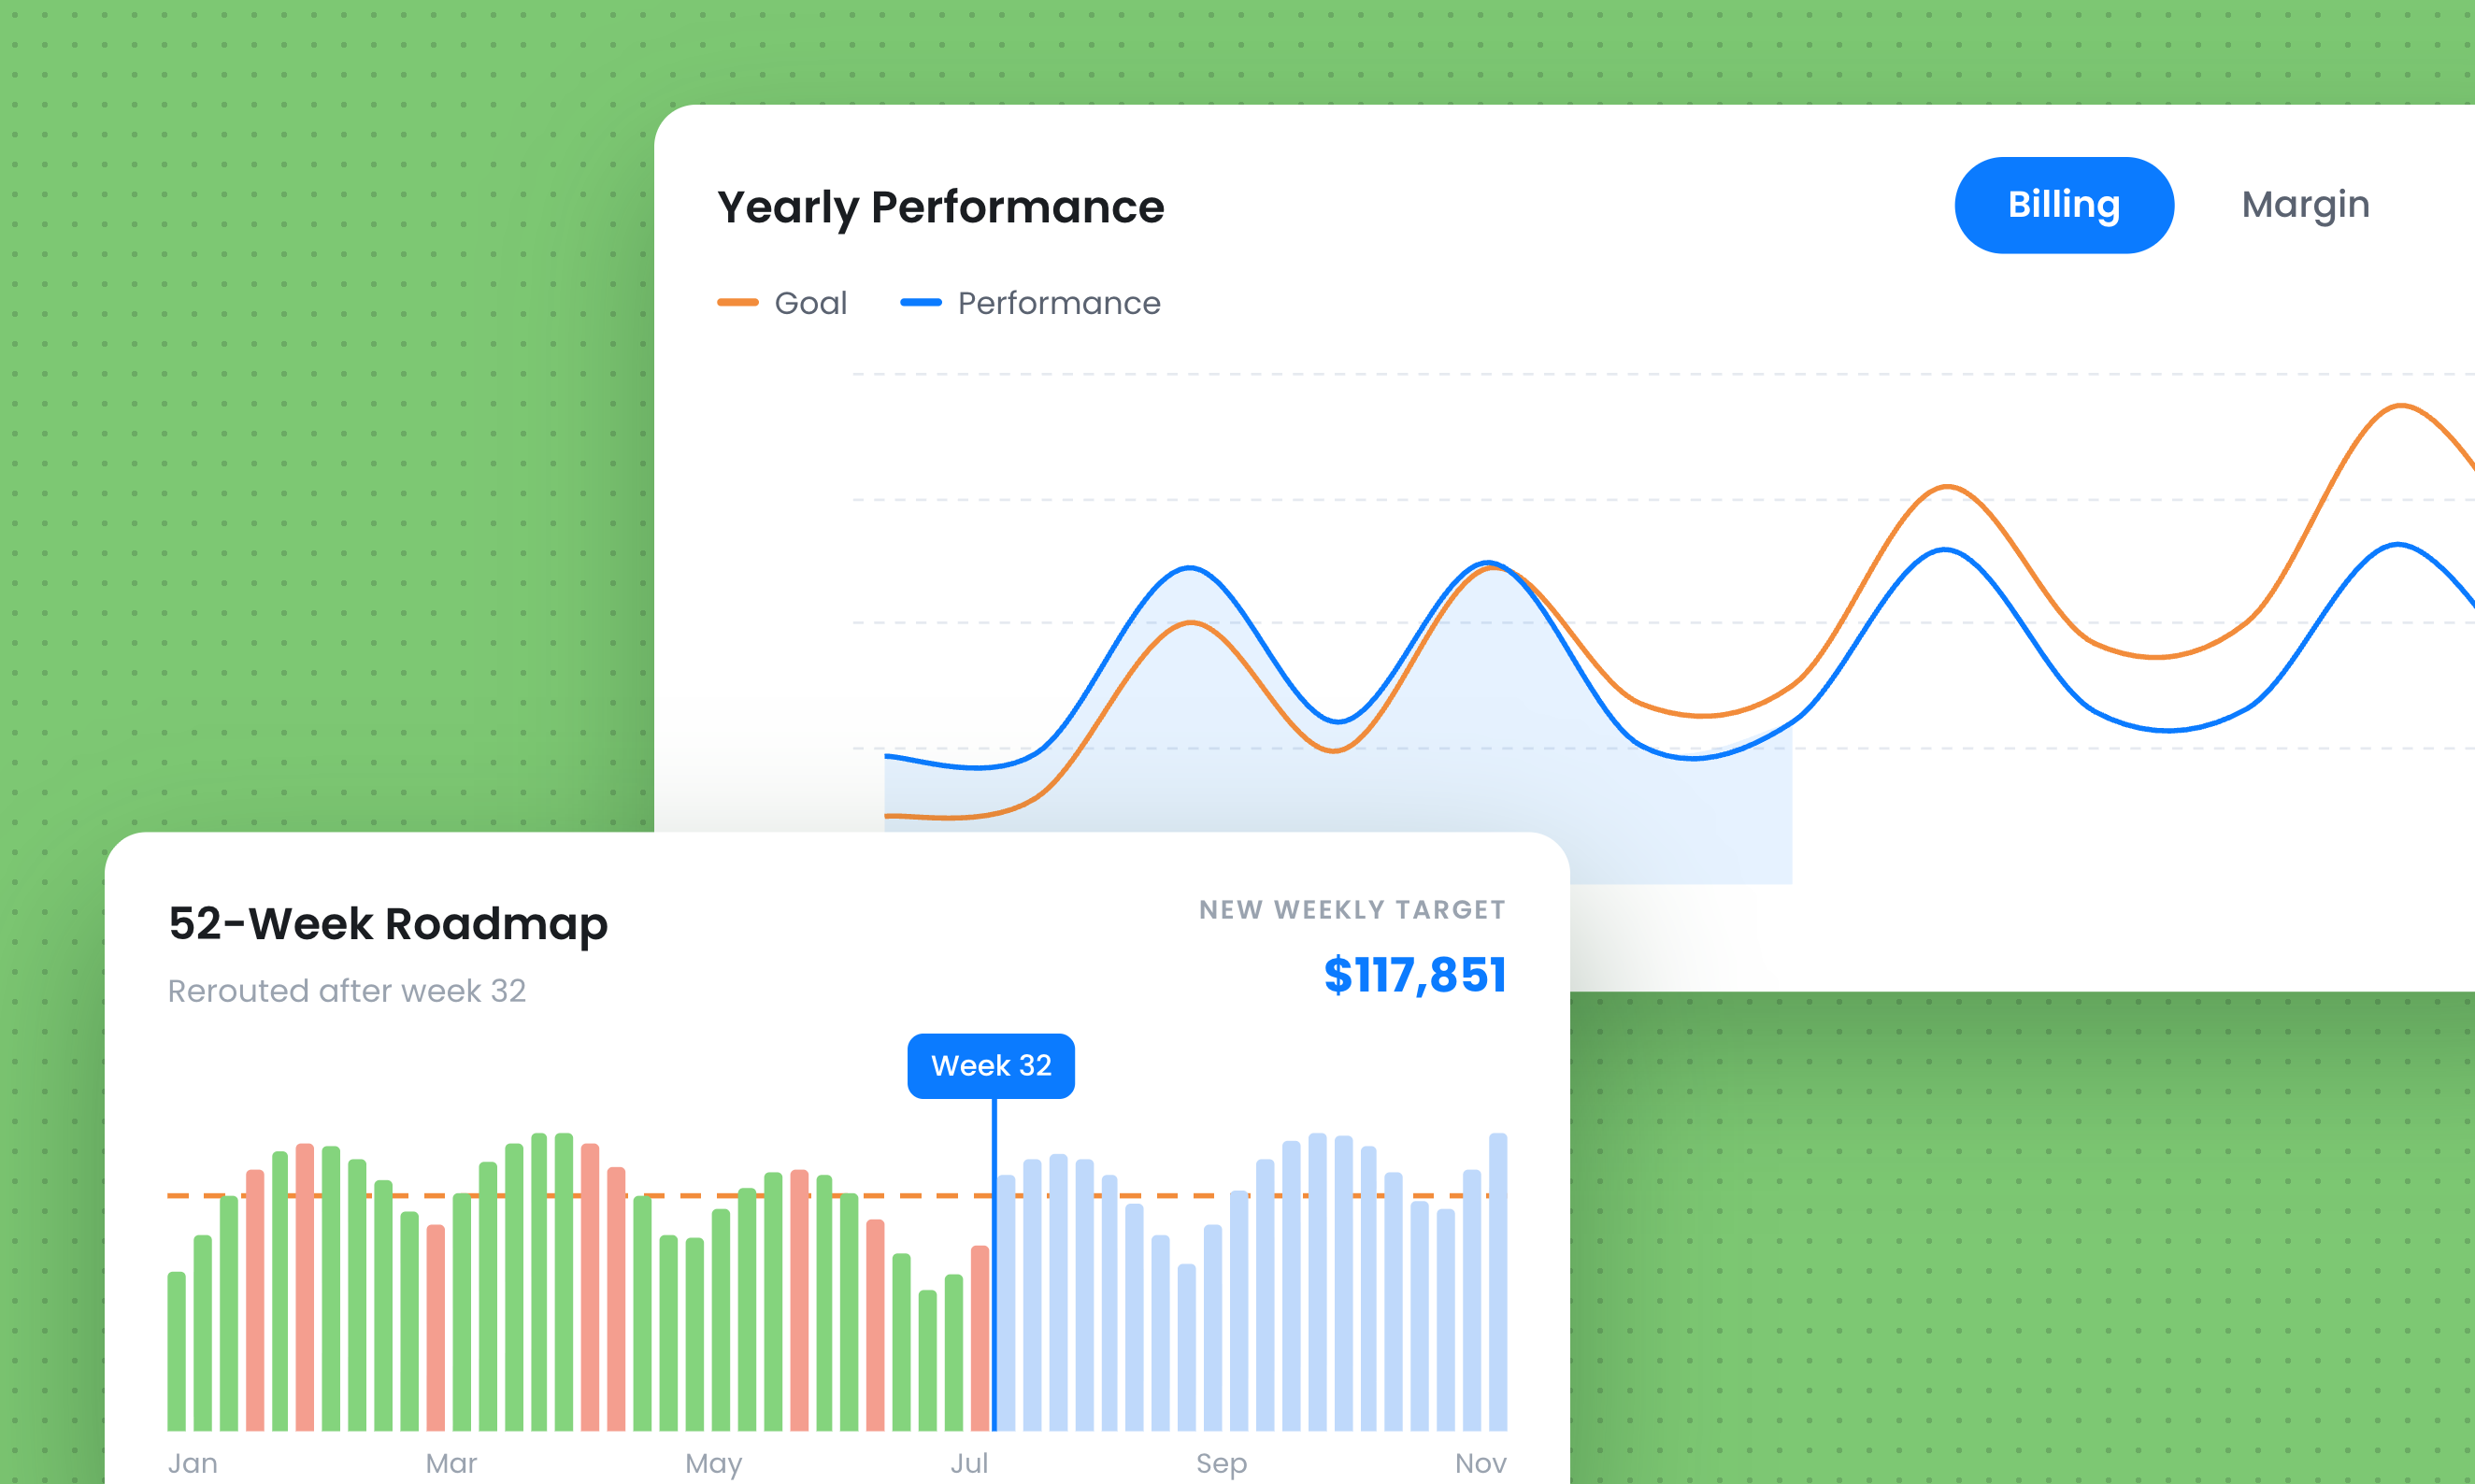
Your roadmap. Recalculated every single week.
Set a goal. Revenue, gross margin, headcount, whatever matters most this year. Staffing Dashboard maps the most efficient 52-week path to get there, based on your agency's real performance history. Then it keeps working. Every week, actual results are compared against what was needed. Fall behind, and the model redistributes the shortfall across the weeks ahead, so the number you need to hit next week is always the real number, not the one you guessed at in January. Most tools show you a target and let you drift. This one keeps rerouting you back to it.
AI Insights Engine
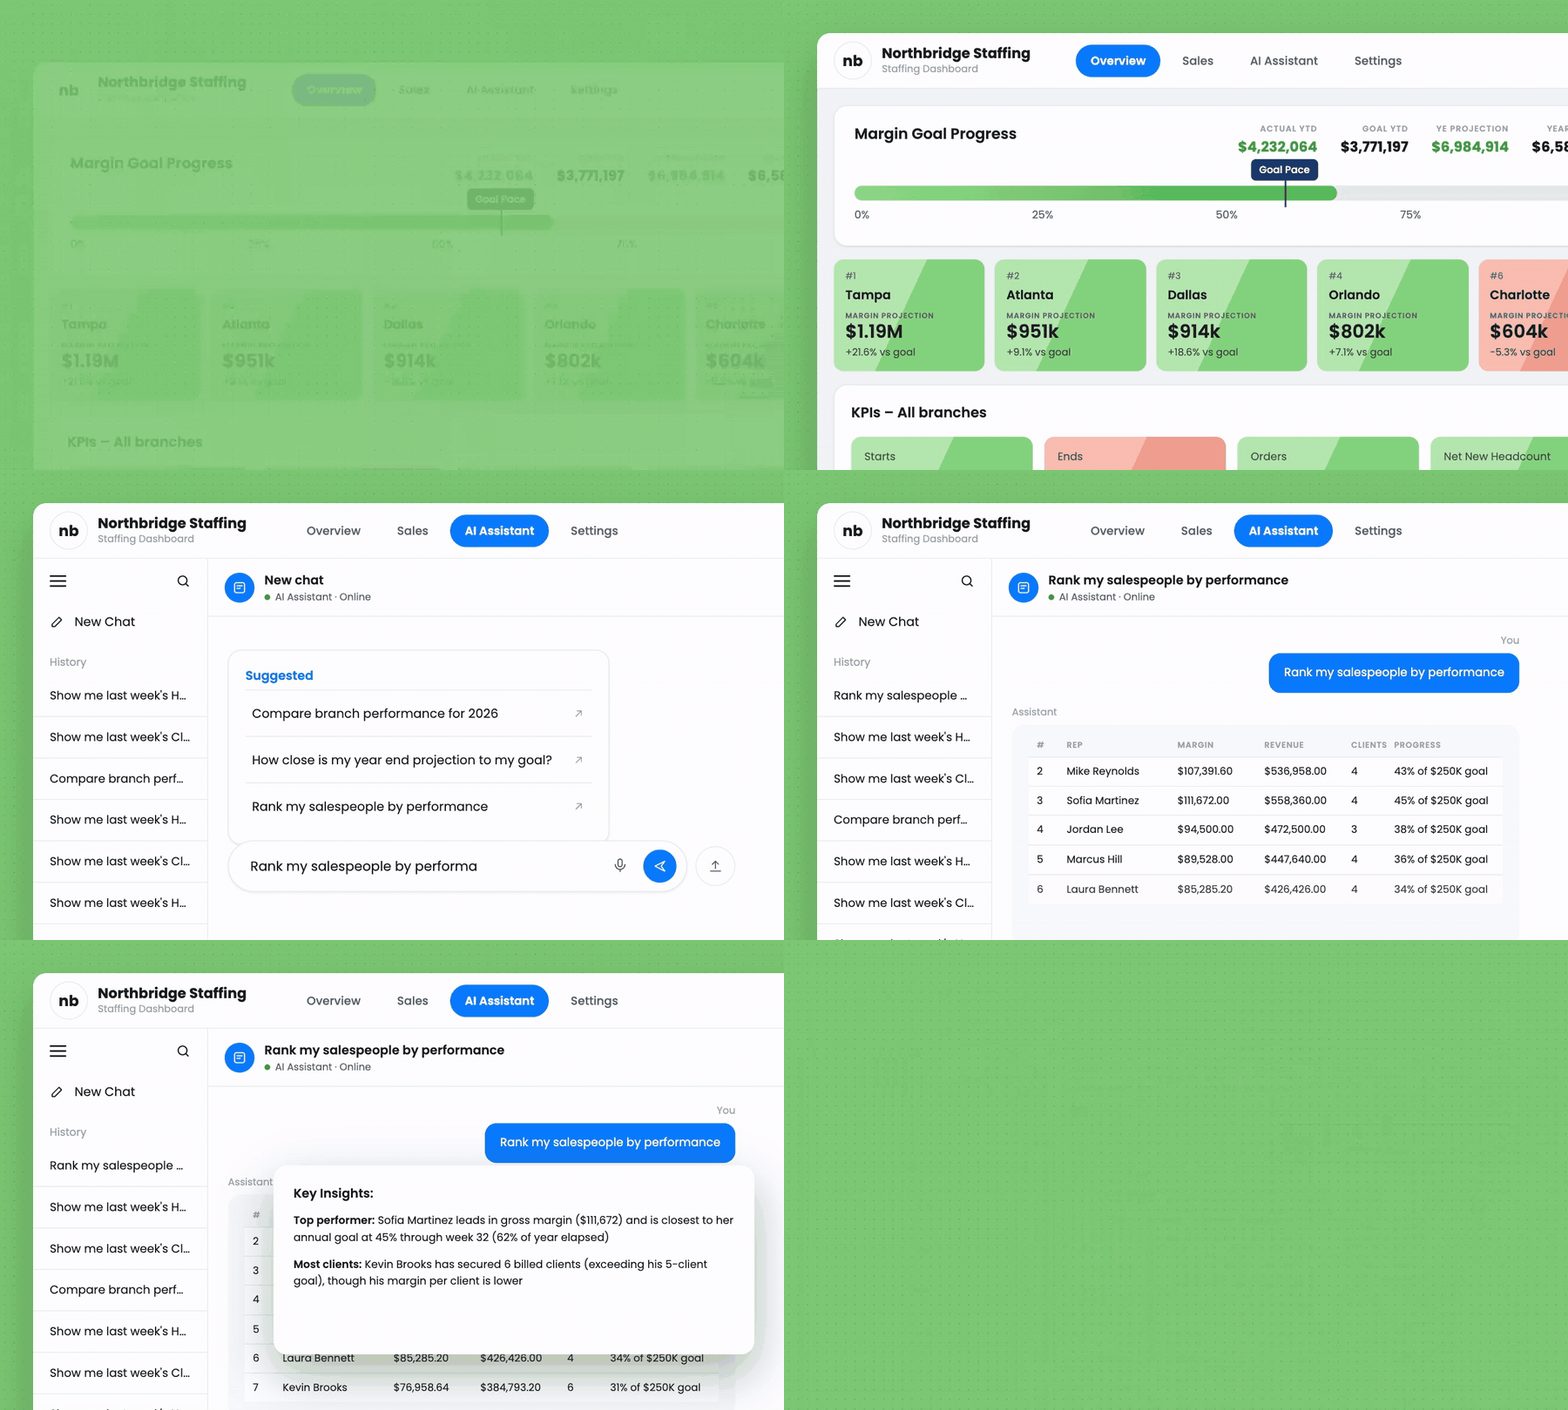
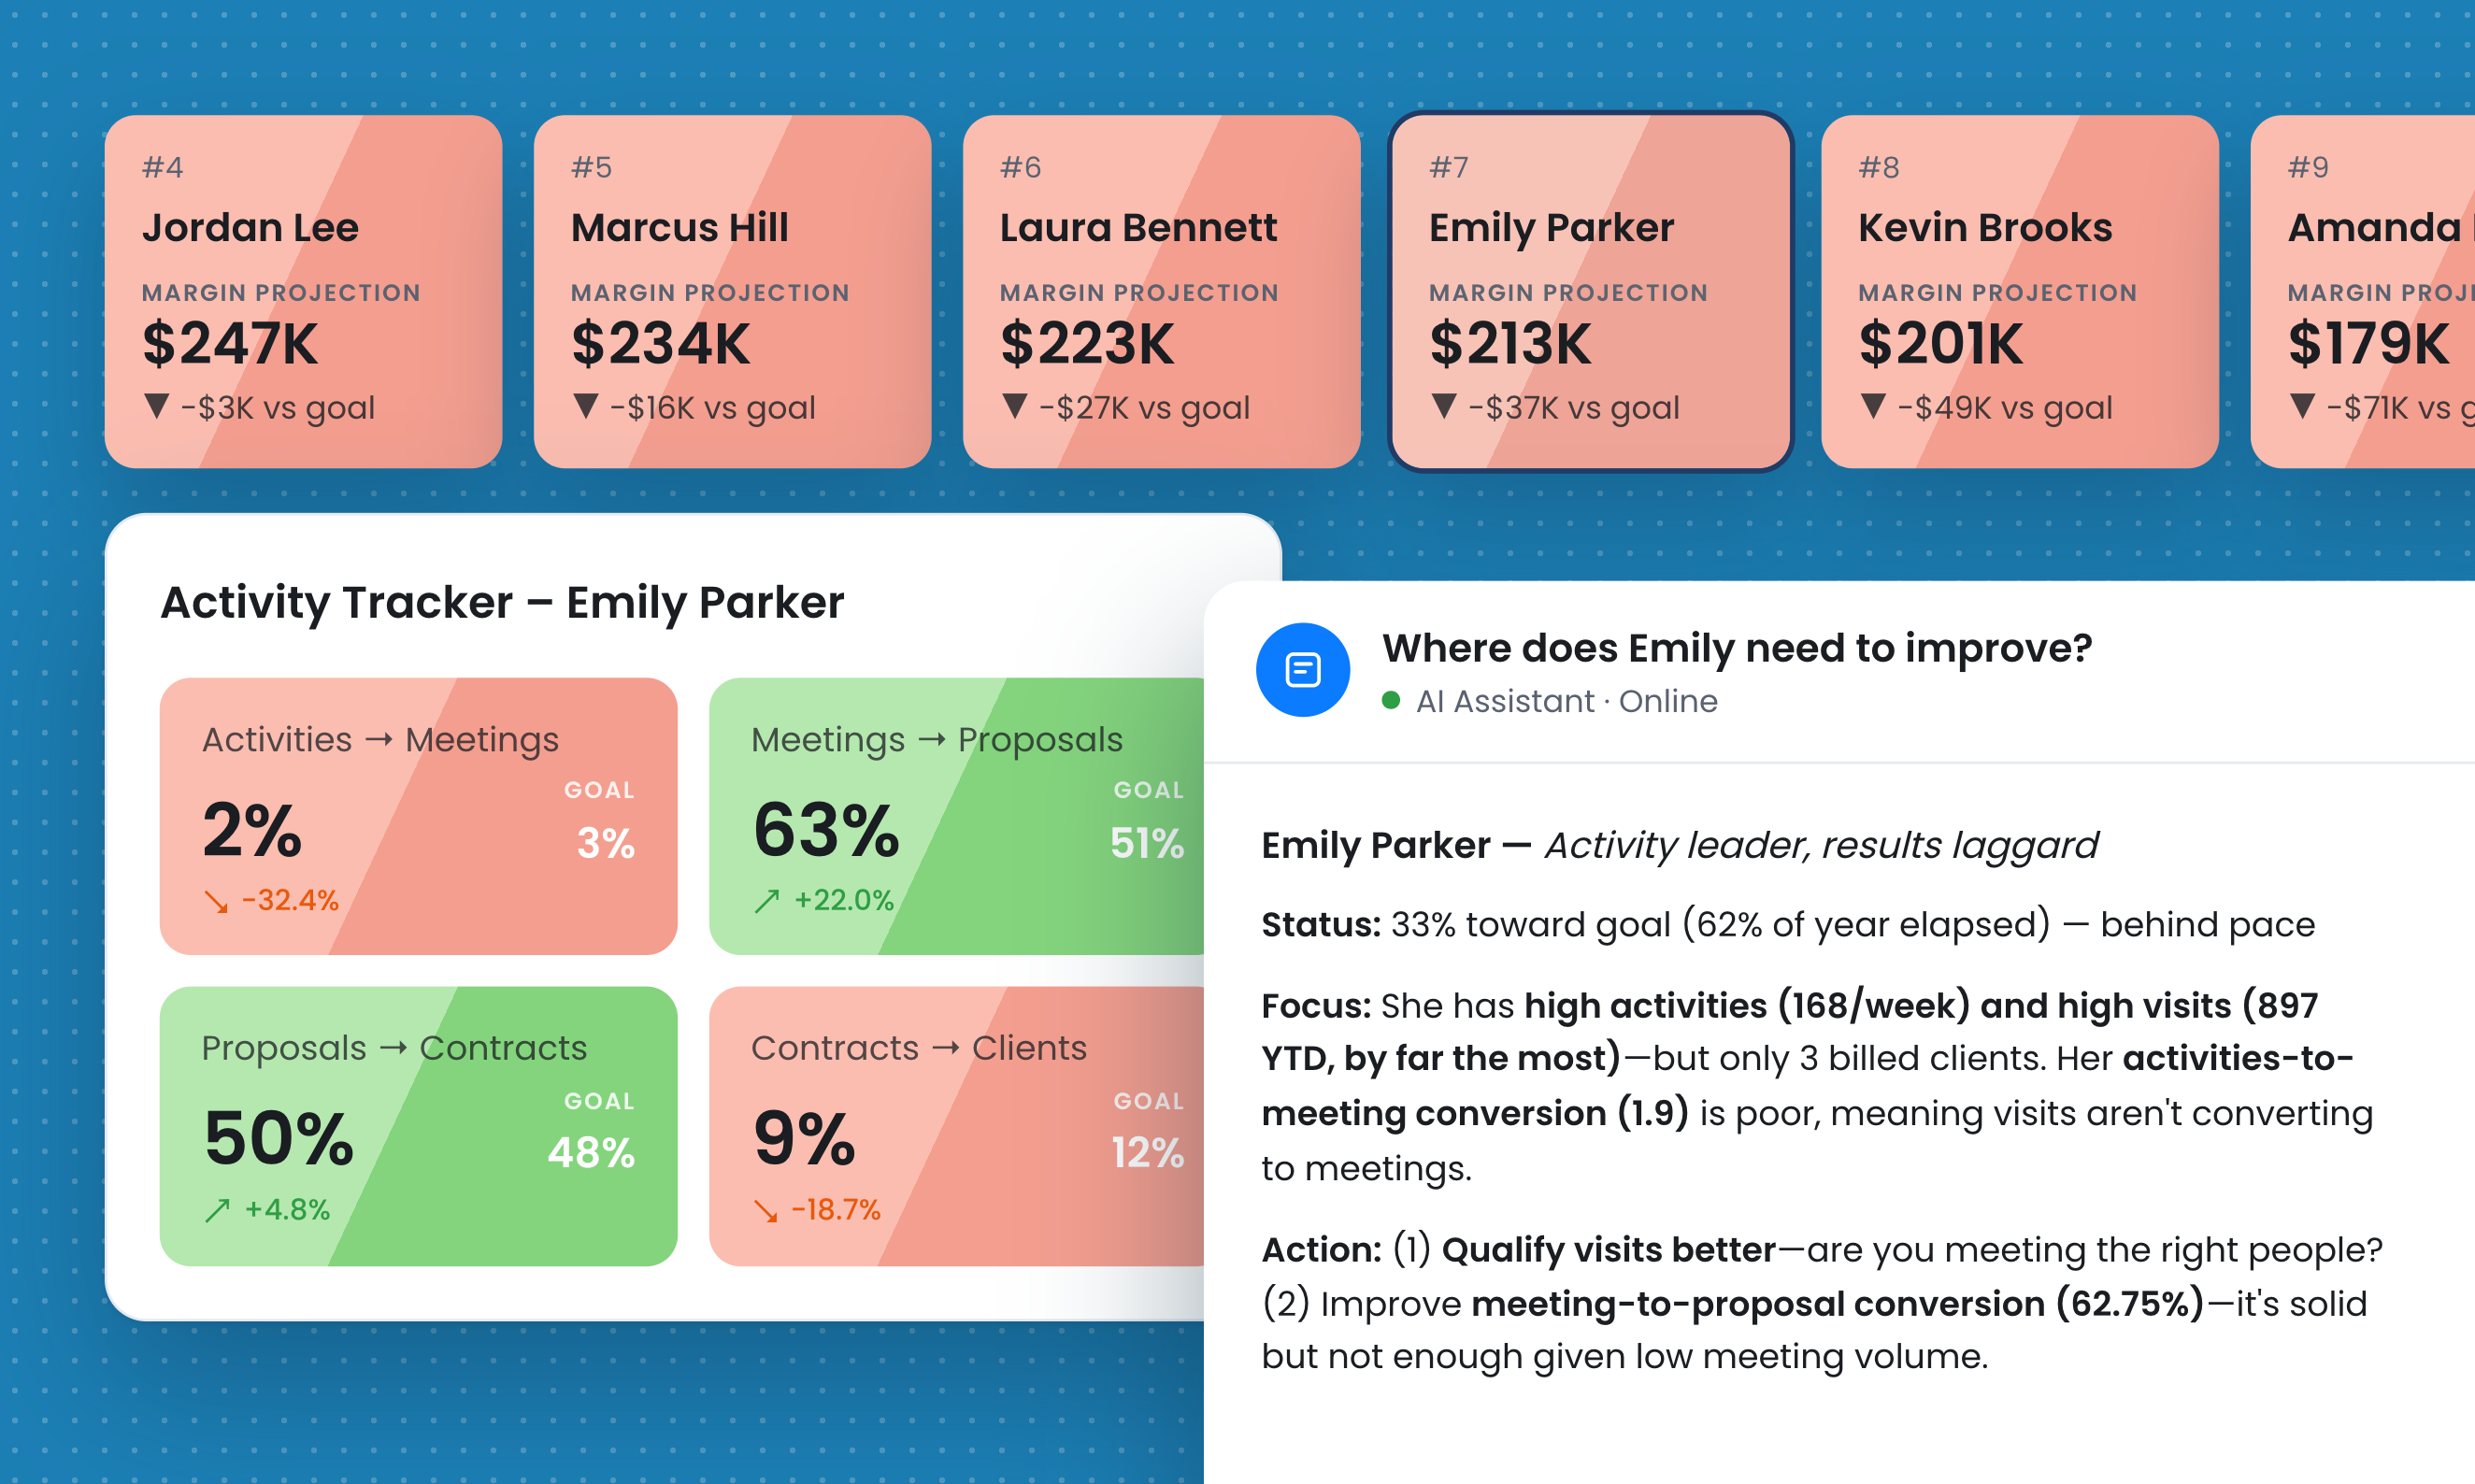
Click a red flag. Get a root cause. In under 5 clicks.
When a KPI is off track, Staffing Dashboard's AI Insights Engine digs in immediately, tracing the miss back to its actual driver. Example: Revenue is under target, because fill rate is under target, because job volume has outpaced your team's capacity. Now you know what to fix, not just that something's broken. This isn't a general-purpose AI bolted onto a report. It's trained exclusively on staffing executive decision models, the way experienced agency leaders actually diagnose and solve problems, so the insights sound like advice from someone who's run a desk, not a chatbot guessing at your spreadsheet.
Voice Mode
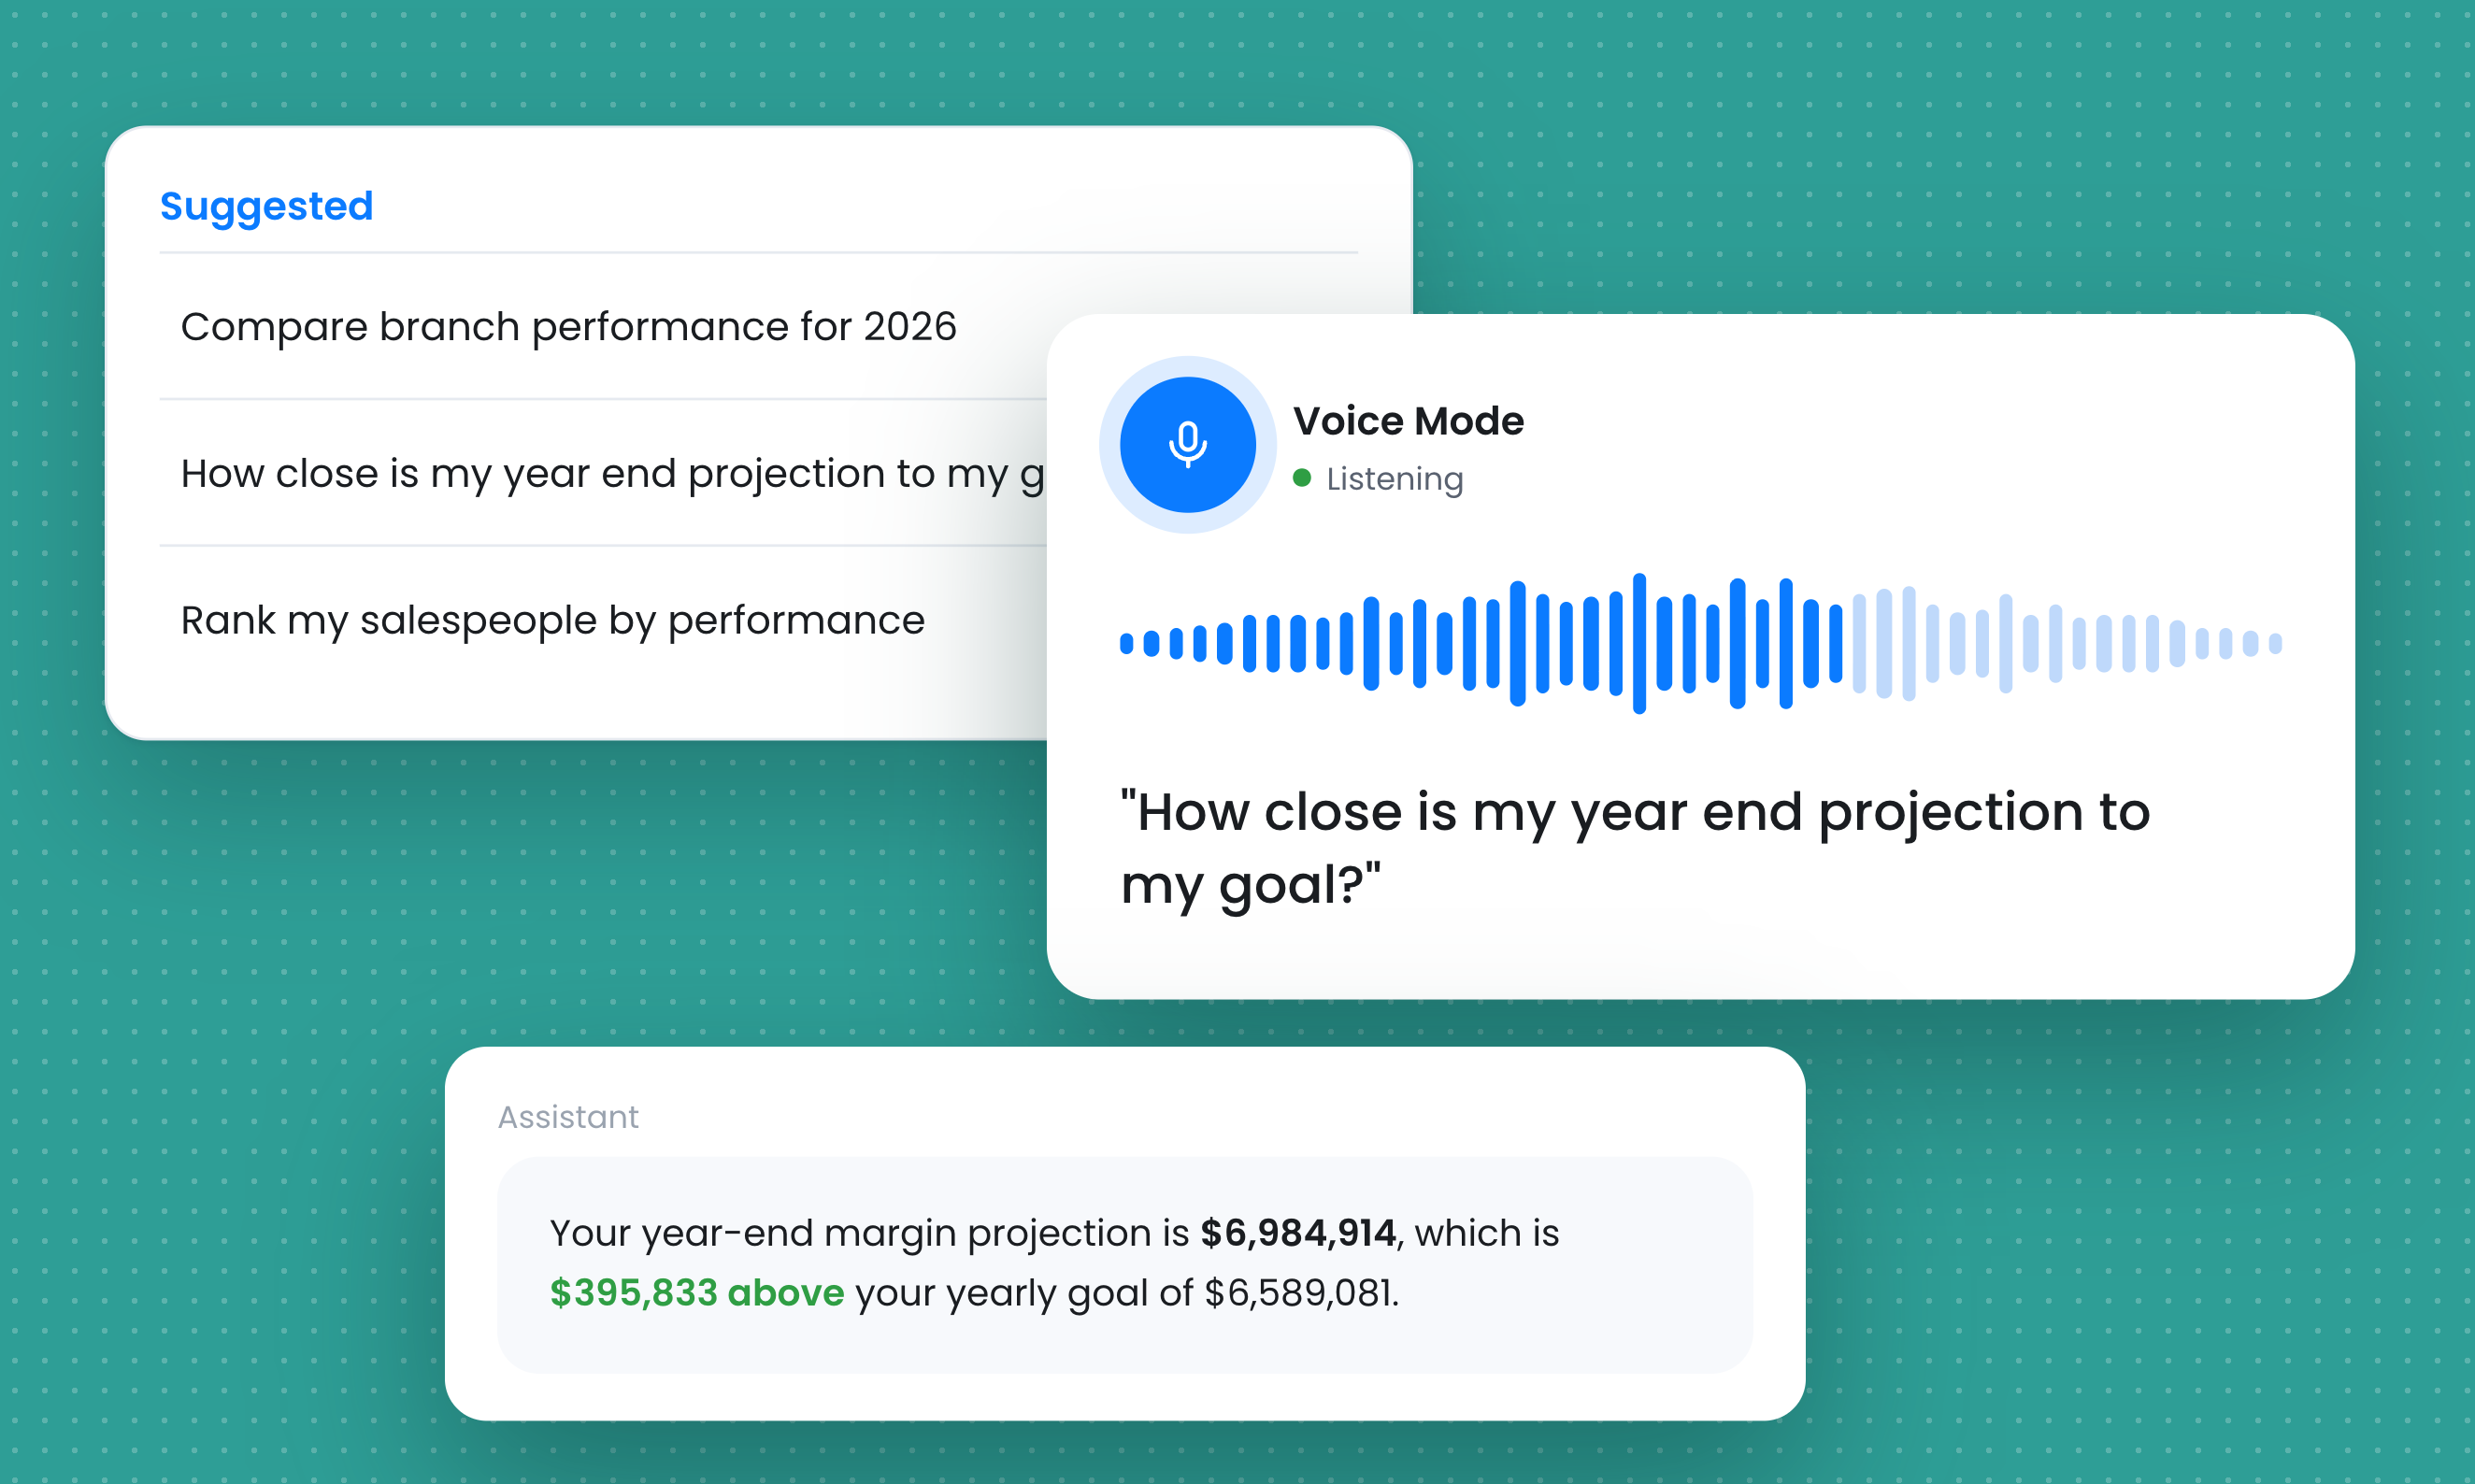
Talk to your data
Ask the way you'd ask your best operator. Who's outperforming, who needs support, and what to do about each of them. You get a direct, spoken answer back. "Tell me my top and bottom performing salespeople, and how I should support each of them this week." Staffing Dashboard answers. No digging through tabs.
Sales + Executive Tools
Built for how staffing leadership actually runs meetings.
Sales Dashboard & Activity Tracking
Pipeline, activity, and performance for every rep, rolled up to the branch and company level
Executive Performance Reporting
Built-in reports ready for your leadership meeting, no manual deck-building
Weekly Performance Review Tools
The same weekly cadence high-performing agencies already run, just faster
Scenario Planning
Scale tierModel what happens to your roadmap before you make the call, not after
Why We're Different
Spreadsheets are messy. This is ready to use.
Google Sheets and Excel get the job done until they don't. They're manual, easy to break, and usually living in one person's head. Staffing Dashboard is ready to use, with no custom build to maintain, and it's trained on how staffing agencies actually make decisions. A staffing agency owner built it after hitting the ceiling of static reports.